Lesson 16 - Multivariate Statistics and Dimension Reduction
| Key Learning Goals for this Lesson: |
|
Introduction
Multivariate Statistics
For many of our analyses, we did a test for each feature. However, for clustering and classification, we used a subset of the features simultaneously. Methods that use multiple features are called multivariate methods and are the topic of this chapter.
Multivariate methods may be supervised or unsupervised. Unsupervised methods such as clustering are exploratory in nature. They help you find patterns that you didn't know were there and may also help you confirm patterns that were you knew were there. Supervised methods use some type of response variable to discover patterns associated with the response.
Unsupervised methods often work reasonably well even without replication in the data (as long as there are multiple conditions). Basically, they organize the data matrix into clusters of rows (features) or columns (samples) that have similar patterns. The features or samples in the clusters then serve as if they were replicates. We have already seen an example in cluster analysis, where we clustered the differentially expressing genes. We can see the dominant expression pattern in each cluster, and perhaps summarize it by averaging the component gene expressions for each treatment.
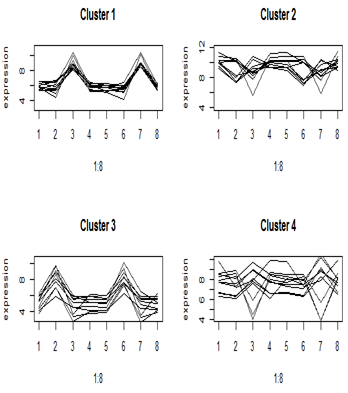
Here are the cluster profiles that we got from four of the eight clusters that we pulled out of the primate brain data using Euclidean distance. There were four brain regions and two species, giving eight treatment means. Clusters 1 and 3 show some clear patterns in gene expression, but clusters 2 and 4 appear to be genes with similar mean expression levels.
One-variable-at-a-time analyses such as t-tests and Fisher’s exact test do not take advantage of patterns across genes (although we have borrowed information from all of the genes to get estimates of the variance). For each gene we did a test of whether was differentially expressed. These are therefore called univariate methods.
Multivariate methods like clustering take advantage of the similarities among the features to reduce the data to a smaller number of patterns (sometimes called "eigenfeatures"). For some analyses, we prefer to take advantage of the similarities among the samples to obtain "eigensamples". Since there are fewer eigenfeatures than features, and fewer eigensamples than samples, we call these methods "dimension reduction" methods.
Dimension reduction is a set of multivariate techniques that find patterns in high dimensional data. Many commonly used dimension reduction methods are simple decompositions of the data matrix into a product of simpler matrices.
Dimension reduction methods come in unsupervised and supervised forms. Unsupervised methods include the singular value decomposition (SVD) and principal components analysis (PCA) which use only the matrix of features by samples as well as clustering. Supervised methods include multiple regression and classification, as well as more recently developed techniques such as sliced inverse regression (SIR) and require a response variable, which is usually a phenotype, in addition to the feature by sample matrix.

