7.2.2 - Proportion 'Greater Than'
7.2.2 - Proportion 'Greater Than'The following two examples use Minitab to find the area under a normal distribution that is greater than a given value. The first example uses the standard normal distribution (i.e., z distribution), which has a mean of 0 and standard deviation of 1; this is the default when first constructing a probability distribution plot in Minitab. The second example models a normal distribution with a mean of 65 and standard deviation of 5.
Later in this lesson we'll see that these methods can be used to identify p values when conducting right-tailed hypothesis tests.
Minitab® – Proportion Greater Than a Value on a Normal Distribution
Question: What proportion of the standard normal distribution is greater than a z score of 2?
Recall that the standard normal distribution (i.e., z distribution) has a mean of 0 and standard deviation of 1. This is the default normal distribution in Minitab.
- From the tool bar select Graph > Probability Distribution Plot > One Curve > View Probability
- Check that the Mean is 0 and the Standard deviation is 1
- Select Options
- Select A specified x value
- Select Right tail
- For X value enter 2
- Click Ok
- Click Ok
This should result in the following output:
The area of the z distribution that is greater than 2 is 0.02275.
This could also be written in probability notation as P(z > 2) = 0.02275.
Minitab® – Proportion Greater Than a Value on a Normal Distribution
Question: Vehicle speeds at a highway location have a normal distribution with a mean of 65 mph and a standard deviation of 5 mph. What is the probability that a randomly selected vehicle will be going more than 73 mph?
Let's construct a normal distribution with a mean of 65 and standard deviation of 5 to find the area greater than 73.
To calculate a probability for values greater than a given value in Minitab:
- From the tool bar select Graph > Probability Distribution Plot > One Curve > View Probability
- Change the Mean to 65 and the Standard deviation to 5
- Select Options
- Select A specified x value
- Select Right tail
- For X value enter 73
- Click Ok
- Click Ok
This should result in the following output:
On a normal distribution with a mean of 65 and standard deviation of 5, the proportion greater than 73 is 0.05480.
In other words, 5.480% of vehicles will be going more than 73 mph.
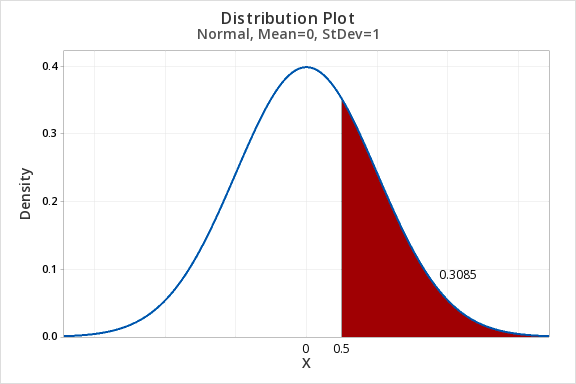
7.2.2.1 - Example: P(Z>0.5)
7.2.2.1 - Example: P(Z>0.5)Question: What proportion of the z distribution is greater than z = 0.5?
- In Minitab select Graph > Probability Distribution Plot > One Curve > View Probability, hit OK.
- Select Normal and enter 0 for the mean and 1 for the standard deviation.(Note: The default is the standard normal distribution)
- Select Options
- Select A specified x value
- Select Right Tail
- For X value enter 0.5
- Click OK