7.2.3 - Proportion 'In between'
7.2.3 - Proportion 'In between'In the following examples we will use Minitab to find the area under a normal distribution between two values. The first example uses the z distribution and the second example uses a normal distribution with a mean of 65 and standard deviation of 5.
Minitab® – Area Between Two z Values
Question: What proportion of the standard normal distribution is between a z score of 0 and a z score of 1.75?
Recall that the standard normal distribution (i.e., z distribution) has a mean of 0 and standard deviation of 1. This is the default normal distribution in Minitab.
- From the tool bar select Graph > Probability Distribution Plot > One Curve > View Probability
- Check that the Mean is 0 and the Standard deviation is 1
- Select Options
- Select A specified x value
- Select Middle
- For X value 1 enter 0
- For X value 2 enter 1.75
- Click Ok
- Click Ok
This should result in the following output:
The proportion of the z distribution that is between 0 and 1.75 is 0.4599.
In probability notation, this could be written as P(0 ≤ z ≤ 1.75) = 0.4599
Minitab®
Area Between Two Values on a Normal Distribution
Question: Vehicle speeds at a highway location have a normal distribution with a mean of 65 mph and a standard deviation of 5 mph. What is the probability that a randomly selected vehicle will be going between 60 mph and 73 mph?
Let's construct a normal distribution with a mean of 65 and standard deviation of 5 to find the area between 60 and 73.
- From the tool bar select Graph > Probability Distribution Plot > One Curve > View Probability
- Change the Mean to 65 and the Standard deviation to 5
- Select Options
- Select A specified x value
- Select Middle
- For X value 1 enter 60
- For X value 2 enter 73
- Click Ok
- Click Ok
This should result in the following output:
On a normal distribution with a mean of 65 mph and standard deviation of 5 mph, the proportion of observations between 60 mph and 73 mph is 0.7865.
In other words, 78.65% of vehicles will be going between 60 mph and 73 mph.
7.2.3.1 - Example: Proportion Between z -2 and +2
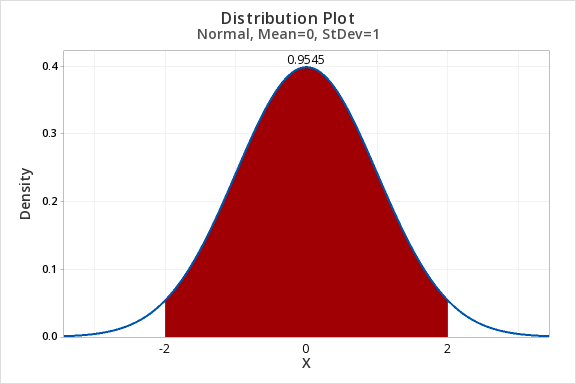
7.2.3.1 - Example: Proportion Between z -2 and +2Question: What proportion of the z distribution is between -2 and 2?
- In Minitab select Graph > Probability Distribution Plot > One Curve > View Probability, hit OK.
- Select Normal and enter 0 for the mean and 1 for the standard deviation.(Note: The default is the standard normal distribution)
- Select Options
- Select A specified x value
- Select Middle and enter
- X value 1: -2
- X value 2: 2
- Select OK