8.1.2.1.4 - Example: Overweight Citizens
8.1.2.1.4 - Example: Overweight CitizensAccording to the Center for Disease Control (CDC), the percent of adults 20 years of age and over in the United States who are overweight is 69.0% (see http://www.cdc.gov/nchs/fastats/obesity-overweight.htm). One city’s council wants to know if the proportion of overweight citizens in their city is different from this known national proportion. They take a random sample of 150 adults 20 years of age or older in their city and find that 98 are classified as overweight. Let’s use the five step hypothesis testing procedure to determine if there is convincing evidence that the proportion in this city is different from the known national proportion.
\(np_0 =150 (0.690)=103.5 \)
\(n (1-p_0) =150 (1-0.690)=46.5\)
Both \(n p_0\) and \(n (1-p_0)\) are at least 10, this assumption has been met.
Research question: Is this city’s proportion of overweight individuals different from 0.690?
This is a non-directional test because our question states that we are looking for a differences as opposed to a specific direction. This will be a two-tailed test.
\(H_{0}\colon p=0.690\)
\(H_{a}\colon p\neq 0.690\)
Test statistic: One Group Proportion
\(z=\dfrac{\widehat{p}- p_0 }{\sqrt{\frac{p_0 (1- p_0)}{n}}}\)
\(\widehat{p}\) = sample proportion
\(p_{0}\) = hypothesize population proportion
\(n\) = sample size
\(\widehat{p}=\dfrac{98}{150}=.653\)
\( z =\dfrac{0.653- 0.690 }{\sqrt{\frac{0.690 (1- 0.690)}{150}}} = -0.980 \)
Our test statistic is \(z=-0.980\)
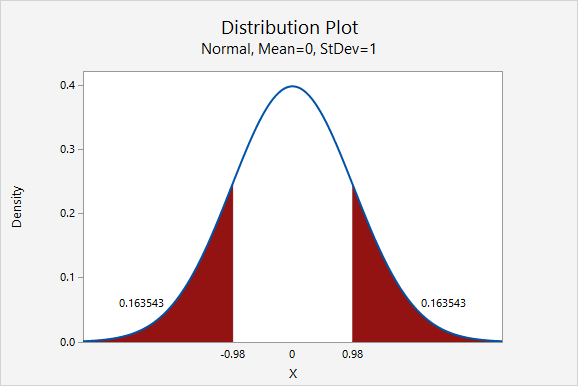
This is a non-directional (i.e., two-tailed) test, so we need to find the area under the z distribution that is more extreme than \(z=-0.980\).
In Minitab, we find the proportion of a normal curve beyond \(\pm0.980\):

\(p-value=0.163543+0.163543=0.327086\)
\(p>\alpha\), therefore we fail to reject the null hypothesis
There is not sufficient evidence to state that the proportion of citizens of this city who are overweight is different from the national proportion of 0.690.