2.1.2.1 - Minitab: Two-Way Contingency Table
2.1.2.1 - Minitab: Two-Way Contingency TableMinitab® – Two-Way Contingency Table
This example will use data collected from a sample of students enrolled in online sections of STAT 200.
To create a two-way table of the Work Status and Primary Campus variables in Minitab:
- Open the data file in Minitab
- From the tool bar, select Stat > Tables > Cross Tabulation and Chi-Square
- We have a data file where each row represents one case, so we will keep the default data entry method of Raw data (categorical variables) in the drop down menu
- Click in the Rows box, then double click the variable Work Status to insert it into the Rows box on the right
- Click in the Columns box, then double click the variable Primary Campus to insert it into the Columns box on the right
- Click OK
This should result in the two-way table below:
| Commonwealth Campus | University Park | World Campus | All | |
|---|---|---|---|---|
| Full-time | 0 | 26 | 78 | 104 |
| Not working | 1 | 99 | 25 | 125 |
| Part-Time | 4 | 96 | 12 | 112 |
| Missing | 0 | 2 | 0 | * |
| All | 5 | 221 | 115 | 341 |
| Cell Contents: Count | ||||
Additional Display Options
The default in Minitab is to display the counts. Under Display you also have the option to select Row percents, Column percents, and Total percents.
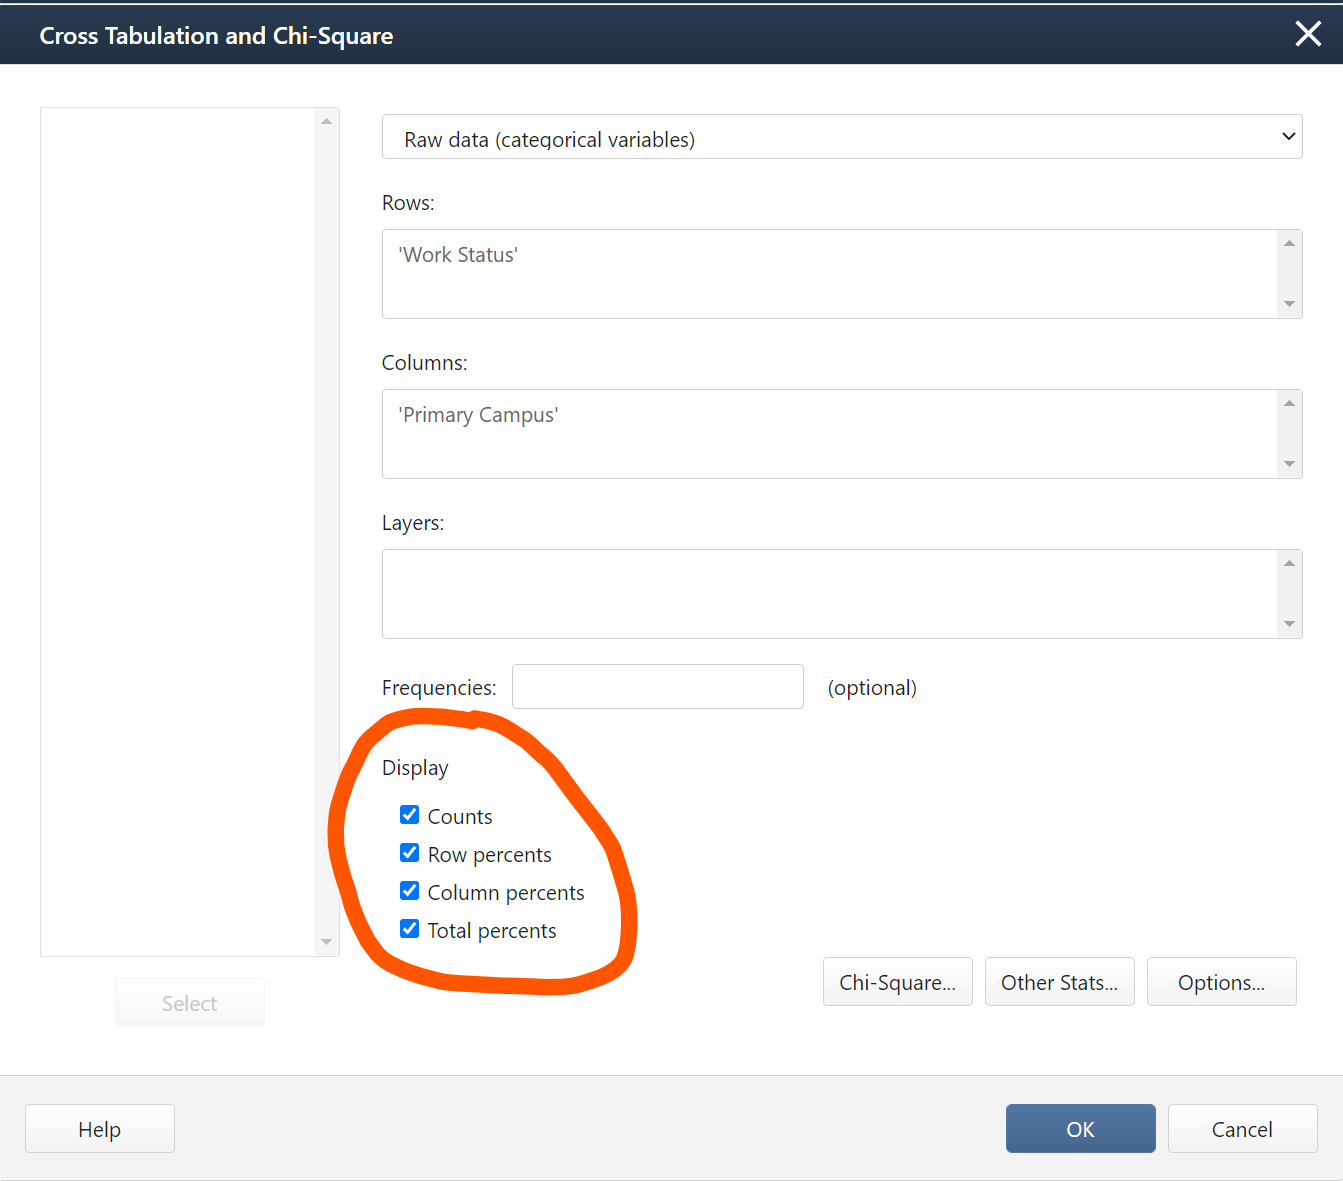
The output below is what you would get if you selected all four display options:
| Commonwealth Campus | University Park | World Campus | All | |
|---|---|---|---|---|
| Full-time |
0 0.00 0.00 0.00 |
26 25.00 11.76 7.62 |
78 75.00 67.83 22.87 |
104 100.00 30.50 30.50 |
| Not working |
1 0.80 20.00 0.29 |
99 79.20 44.80 29.03 |
25 20.00 21.74 7.33 |
125 100.00 36.66 36.66 |
| Part-Time |
4 3.57 80.00 1.17 |
96 85.71 43.44 28.15 |
12 10.71 10.43 3.52 |
112 100.00 32.84 32.84 |
| Missing |
0 * * * |
2 * * * |
0 * * * |
* * * * |
| All |
5 1.47 100.00 1.47 |
221 64.81 100.00 64.81 |
115 33.72 100.00 33.72 |
341 100.00 100.00 100.00 |
|
Cell Contents |
||||
Here, each cell contains four values. The top number in each cell is the count. This is the number of students in that group. For example, there were 78 World Campus students who were working full-time.
The second number in each cell is the percentage of the row. In the cell for World Campus students working full-time, that value is 75.00. The row represents the students who were working full-time. This means that 75% of all students who were working full time were World Campus students. This is an example of a conditional probability: P(World Campus | Full-Time).
The third number in each cell is the percentage for that column. In the cell for World Campus students working full-time, that value is 67.83. The column represents World Campus. This means that 67.83% of all World Campus students were working full-time. This is an example of a conditional probability: P(Full-Time | World Campus).
The last number in each cell is the percentage of the total. In the cell for World Campus students working full-time, that value is 22.87. This means that 22.87% of all students who completed this survey were World Campus students who were working full-time. This is an example of an intersection: P(World Campus ∩ Full-Time).