7.2.1.2 - Example: P(SATM<540)
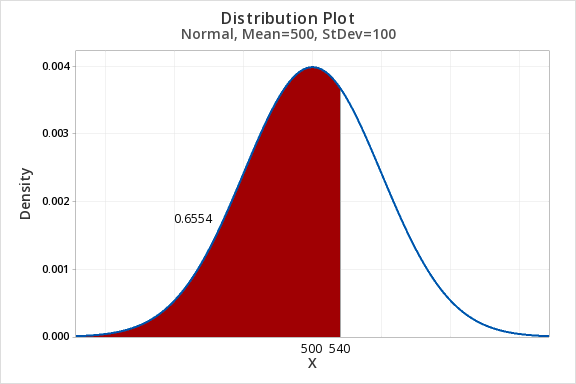
7.2.1.2 - Example: P(SATM<540)Question: SAT-Math scores are normally distributed with a mean of 500 and standard deviation of 100. What proportion of scores are less than 540?
Steps
- In Minitab choose Graph > Probability Distribution Plot > View Probability
- For Distribution select Normal (Note: This is the default)
- For Mean enter 500
- For Standard deviation enter 100
- Select Options
- Select A specified X value
- Select Left tail
- For X value enter 540
The proportion of scores less than 540 is 0.6554.