4.4.2 - StatKey: Percentile Method
4.4.2 - StatKey: Percentile MethodRegardless of the shape of the bootstrap sampling distribution, we can use the percentile method to construct a confidence interval. Using this method, the 95% confidence interval is the range of points that cover the middle 95% of bootstrap sampling distribution. The following examples use StatKey.
To construct a 95% bootstrap confidence interval using the percentile method follow these steps:
- Determine what type(s) of variable(s) you have and what parameters you want to estimate. StatKey will bootstrap a confidence interval for a mean, median, standard deviation, proportion, different in two means, difference in two proportions, regression slope, and correlation (Pearson's r).
- Get your sample data into StatKey. There are some built-in datasets and you always have the ability to enter in your own data. This procedure varies depending on the test you're conducting. For a proportion, you need to enter the number of successes and number of trials. For anything involving quantitative data you will need to copy and paste your data into StatKey (this is the recommended method) or upload it as a txt, csv, or tsv file.
- Generate at least 5,000 bootstrap samples.
- Check the "Two-Tail" box at the upper left corner of the bootstrap dotplot. By default, this will give you a 95% confidence interval.
The default in StatKey is to construct a 95% confidence interval. You can change the confidence level by clicking the "0.950" in the center and entering the confidence level you want. For example, for a 90% confidence interval you would enter "0.90." Below is a short video demonstrating this.
4.4.2.1 - Example: Correlation Between Quiz & Exam Scores
4.4.2.1 - Example: Correlation Between Quiz & Exam ScoresThe following video constructs a 95% confidence interval for the correlation between STAT 200 students' quiz scores and final exam scores.
These data can be found in
4.4.2.2 - Example: Difference in Dieting by Biological Sex
4.4.2.2 - Example: Difference in Dieting by Biological Sex
4.4.2.3 - Example: One sample mean sodium content
4.4.2.3 - Example: One sample mean sodium contentSodium Content: CI for One Sample Mean
A nutritionist is conducting a study on the sodium content in fast food. They have collected a random sample of 50 different fast-food items from several popular fast-food chains, including burgers, fries, salads, and sandwiches. For each item, the sodium content (in milligrams) is recorded.
The Dietary Guidelines for Americans recommend that adults limit their sodium intake to less than 2300 mg per day. By examining the sodium content in these fast-food items, the nutritionist aims to provide more informed dietary information to their clients so that they can make healthier choices based on the sodium levels found in popular fast foods.
Data: FF_sodium.csv
Construct a 90% confidence interval using the percentile method to estimate the average sodium content (mg) in a single fast-food item.
To construct a 90% bootstrap confidence interval using the percentile method follow these steps:
- Determine what type(s) of variable(s) you have and what parameters you want to estimate.
In this scenario, we are dealing with the average sodium content (mg) which is a single mean. In StatKey, choose Bootstrap Confidence Intervals > CI for Single Mean, Median, St. Dev.
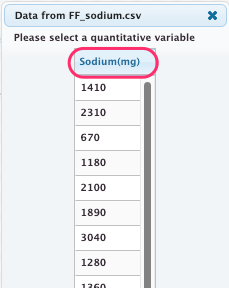
Upload the sample data file into StatKey using the 'Upload File' button.

Select the quantitative variable, 'Sodium(mg)' > 'OK'
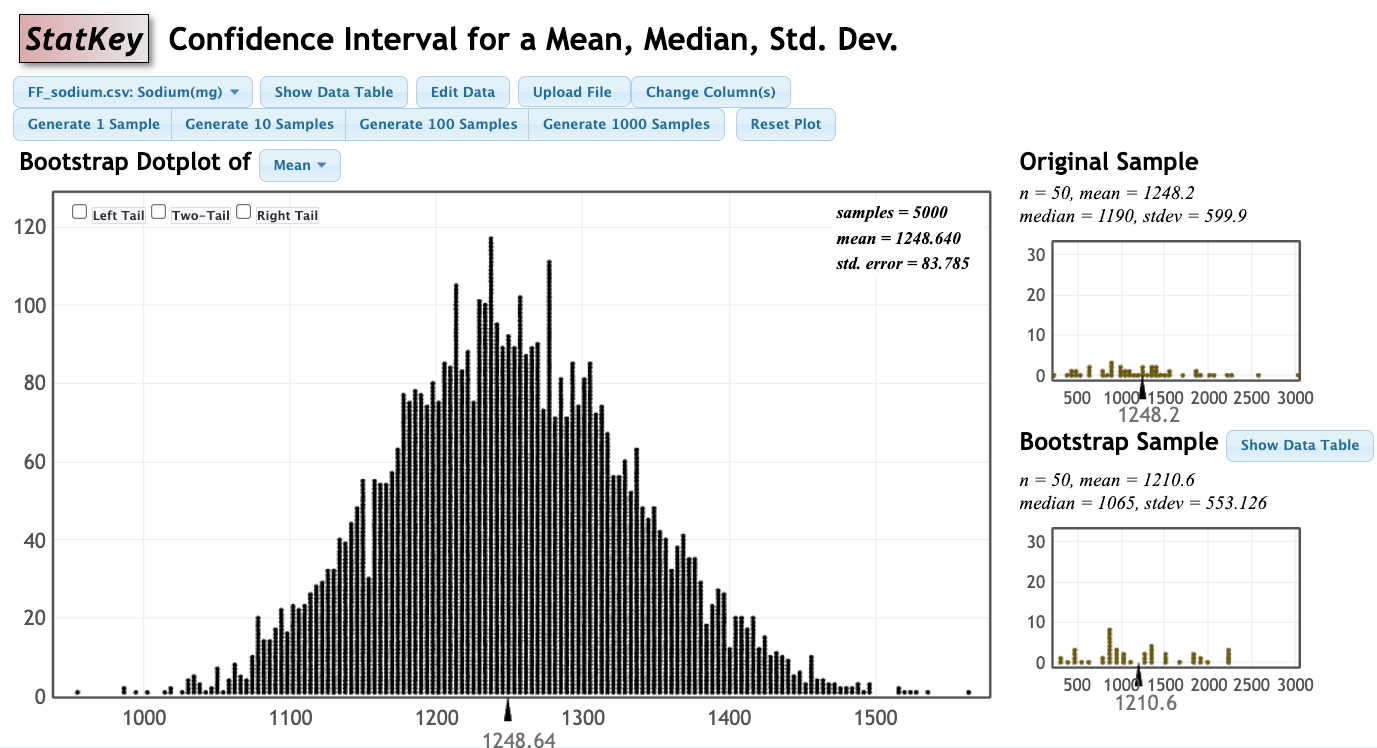
- Generate at least 5,000 bootstrap samples.
- Check the "Two-Tail" box at the upper left corner of the bootstrap dotplot. By default, this will give you a 95% confidence interval. Select the 0.95 box in the middle and change to 0.90 to display the 90% interval.
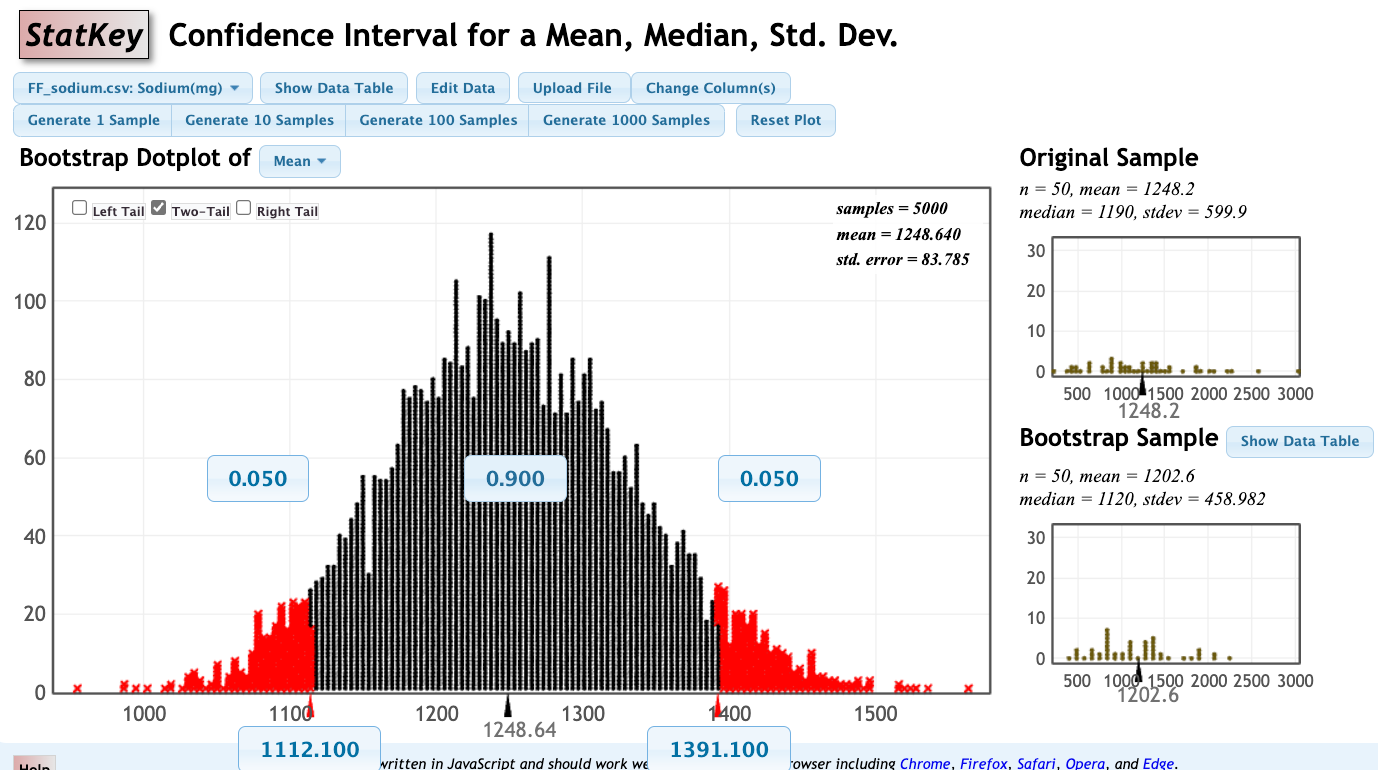
The 90% confidence interval for the average sodium content (mg) of a single fast food item is 1112.1 to 1391.1 mg.