7.2 - Minitab: Finding Proportions Under a Normal Distribution
7.2 - Minitab: Finding Proportions Under a Normal DistributionMinitab can be used to find the proportion of a normal distribution in a given range. The default in Minitab is to construct a standard normal distribution (i.e., z distribution), but the mean and standard deviation of the distribution can be edited. The following pages walk through how to construct normal distributions to find the proportion greater than a given value, the proportion less than a given value, or the proportion between two given values.
Later in this lesson, we'll see that these procedures may be used to find the p value for a given test statistic. For a right-tailed test, the p value is the area greater than the test statistic. For a left-tailed test the p value is the area less than the test statistic. For a two-tailed test, the p value is the total area in the left and right tails that is more extreme than the test statistic.
7.2.1 - Proportion 'Less Than'
7.2.1 - Proportion 'Less Than'The cumulative probability for a value is the probability less than or equal to that value. In notation, this is \(P(X\leq x)\). The proportion at or below a given value is also known as a percentile.
Minitab® – Proportion Less Than a z Value
Question: What proportion of the standard normal distribution is less than a z score of -2?
Recall that the standard normal distribution (i.e., z distribution) has a mean of 0 and standard deviation of 1. This is the default normal distribution in Minitab.
- From the tool bar select Graph > Probability Distribution Plot > One Curve > View Probability
- Check that the Mean is 0 and the Standard deviation is 1
- Select Options
- Select A specified x value
- Select Left tail
- For X value enter -2
- Click Ok
- Click Ok
This should result in the following output:
The proportion of the standard normal distribution that is less than a z score of -2 is 0.02275.
This could also be written as P(z < -2) = 0.02275.
Minitab® – Proportion Less Than a Value on a Normal Distribution
Scenario: Vehicle speeds at a highway location have a normal distribution with a mean of 65 mph and a standard deviation of 5 mph. What is the probability that a randomly selected vehicle will be going 73 mph or slower?
Let's construct a normal distribution with a mean of 65 and standard deviation of 5 to find the area less than 73.
- From the tool bar select Graph > Probability Distribution Plot > One Curve > View Probability
- Change the Mean to 65 and the Standard deviation to 5
- Select Options
- Select A specified x value
- Select Left tail
- For X value enter 73
- Click Ok
- Click Ok
This should result in the following output:
On a normal distribution with a mean of 65 mph and standard deviation of 5 mph, the proportion less than 73 mph is 0.9452.
In other words, 94.52% of vehicles will be going 73 mph or slower.
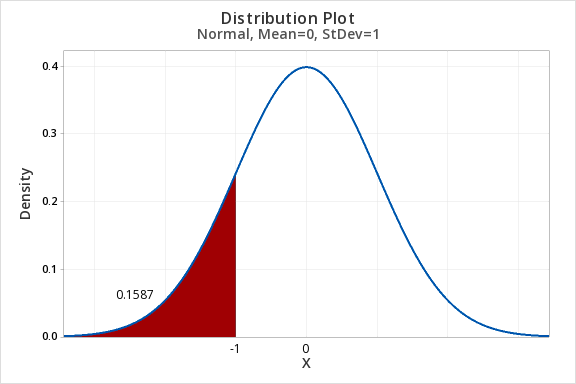
7.2.1.1 - Example: P(Z<-1)
7.2.1.1 - Example: P(Z<-1)Question: What proportion of the z distribution falls below a z score of -1?
- In Minitab select Graph > Probability Distribution Plot > One Curve > View Probability, hit OK.
- Select Normal (Note: The default is the standard normal distribution)
- Select Options
- Select A specified x value
- Select Left Tail
- For X value enter -1
- OK
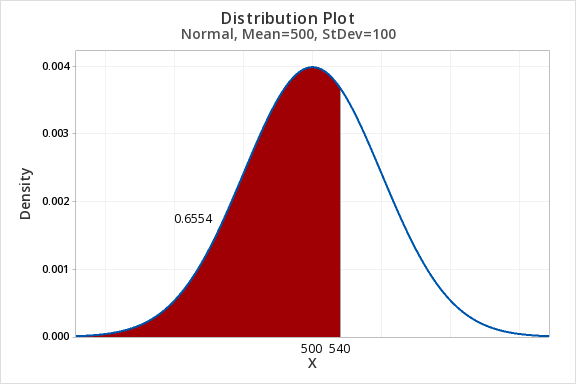
7.2.1.2 - Example: P(SATM<540)
7.2.1.2 - Example: P(SATM<540)Question: SAT-Math scores are normally distributed with a mean of 500 and standard deviation of 100. What proportion of scores are less than 540?
- In Minitab choose Graph > Probability Distribution Plot
- For Distribution select Normal (Note: This is the default)
- For Mean enter 500
- For Standard deviation enter 100
- Select Options
- Select A specified X value
- Select Left tail
- For X value enter 540
7.2.2 - Proportion 'Greater Than'
7.2.2 - Proportion 'Greater Than'The following two examples use Minitab to find the area under a normal distribution that is greater than a given value. The first example uses the standard normal distribution (i.e., z distribution), which has a mean of 0 and standard deviation of 1; this is the default when first constructing a probability distribution plot in Minitab. The second example models a normal distribution with a mean of 65 and standard deviation of 5.
Later in this lesson we'll see that these methods can be used to identify p values when conducting right-tailed hypothesis tests.
Minitab® – Proportion Greater Than a Value on a Normal Distribution
Question: What proportion of the standard normal distribution is greater than a z score of 2?
Recall that the standard normal distribution (i.e., z distribution) has a mean of 0 and standard deviation of 1. This is the default normal distribution in Minitab.
- From the tool bar select Graph > Probability Distribution Plot > One Curve > View Probability
- Check that the Mean is 0 and the Standard deviation is 1
- Select Options
- Select A specified x value
- Select Right tail
- For X value enter 2
- Click Ok
- Click Ok
This should result in the following output:
The area of the z distribution that is greater than 2 is 0.02275.
This could also be written in probability notation as P(z > 2) = 0.02275.
Minitab® – Proportion Greater Than a Value on a Normal Distribution
Question: Vehicle speeds at a highway location have a normal distribution with a mean of 65 mph and a standard deviation of 5 mph. What is the probability that a randomly selected vehicle will be going more than 73 mph?
Let's construct a normal distribution with a mean of 65 and standard deviation of 5 to find the area greater than 73.
To calculate a probability for values greater than a given value in Minitab:
- From the tool bar select Graph > Probability Distribution Plot > One Curve > View Probability
- Change the Mean to 65 and the Standard deviation to 5
- Select Options
- Select A specified x value
- Select Right tail
- For X value enter 73
- Click Ok
- Click Ok
This should result in the following output:
On a normal distribution with a mean of 65 and standard deviation of 5, the proportion greater than 73 is 0.05480.
In other words, 5.480% of vehicles will be going more than 73 mph.
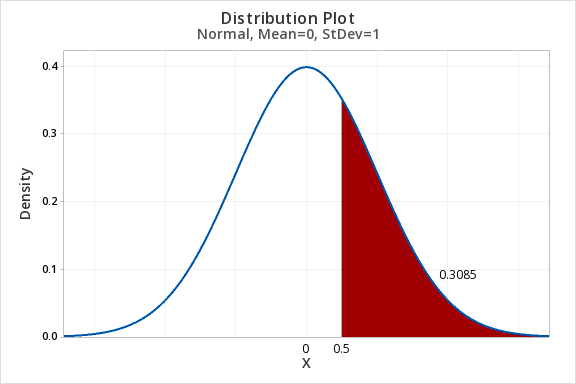
7.2.2.1 - Example: P(Z>0.5)
7.2.2.1 - Example: P(Z>0.5)Question: What proportion of the z distribution is greater than z = 0.5?
- In Minitab select Graph > Probability Distribution Plot > One Curve > View Probability, hit OK.
- Select Normal and enter 0 for the mean and 1 for the standard deviation.(Note: The default is the standard normal distribution)
- Select Options
- Select A specified x value
- Select Right Tail
- For X value enter 0.5
- Click OK
7.2.3 - Proportion 'In between'
7.2.3 - Proportion 'In between'In the following examples we will use Minitab to find the area under a normal distribution between two values. The first example uses the z distribution and the second example uses a normal distribution with a mean of 65 and standard deviation of 5.
Minitab® – Area Between Two z Values
Question: What proportion of the standard normal distribution is between a z score of 0 and a z score of 1.75?
Recall that the standard normal distribution (i.e., z distribution) has a mean of 0 and standard deviation of 1. This is the default normal distribution in Minitab.
- From the tool bar select Graph > Probability Distribution Plot > One Curve > View Probability
- Check that the Mean is 0 and the Standard deviation is 1
- Select Options
- Select A specified x value
- Select Middle
- For X value 1 enter 0
- For X value 2 enter 1.75
- Click Ok
- Click Ok
This should result in the following output:
The proportion of the z distribution that is between 0 and 1.75 is 0.4599.
In probability notation, this could be written as P(0 ≤ z ≤ 1.75) = 0.4599
Minitab®
Area Between Two Values on a Normal Distribution
Question: Vehicle speeds at a highway location have a normal distribution with a mean of 65 mph and a standard deviation of 5 mph. What is the probability that a randomly selected vehicle will be going between 60 mph and 73 mph?
Let's construct a normal distribution with a mean of 65 and standard deviation of 5 to find the area between 60 and 73.
- From the tool bar select Graph > Probability Distribution Plot > One Curve > View Probability
- Change the Mean to 65 and the Standard deviation to 5
- Select Options
- Select A specified x value
- Select Middle
- For X value 1 enter 60
- For X value 2 enter 73
- Click Ok
- Click Ok
This should result in the following output:
On a normal distribution with a mean of 65 mph and standard deviation of 5 mph, the proportion of observations between 60 mph and 73 mph is 0.7865.
In other words, 78.65% of vehicles will be going between 60 mph and 73 mph.
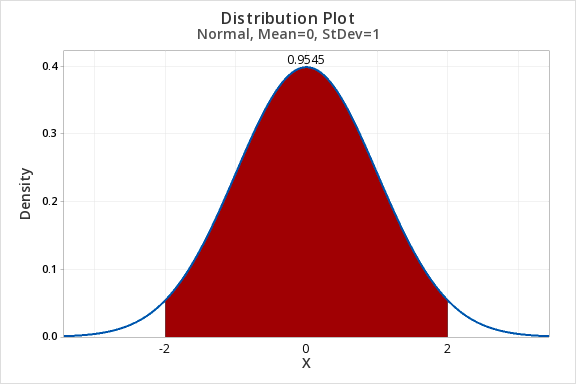
7.2.3.1 - Example: Proportion Between z -2 and +2
7.2.3.1 - Example: Proportion Between z -2 and +2Question: What proportion of the z distribution is between -2 and 2?
- In Minitab select Graph > Probability Distribution Plot > One Curve > View Probability, hit OK.
- Select Normal and enter 0 for the mean and 1 for the standard deviation.(Note: The default is the standard normal distribution)
- Select Options
- Select A specified x value
- Select Middle and enter
- X value 1: -2
- X value 2: 2
- Select OK
7.2.4 - Proportion 'More Extreme Than'
7.2.4 - Proportion 'More Extreme Than'Minitab® – Proportion More Extreme than a z Score
Question: What proportion of the standard normal distribution is more extreme than a z value of ±2?
- From the tool bar select Graph > Probability Distribution Plot > One Curve > View Probability
- Check that the Mean is 0 and the Standard deviation is 1
- Select Options
- Select A specified x value
- Select Equal Tails
- For X value enter 2 or -2*
- Click Ok
- Click Ok
* By default, "equal tails" will result in a symmetric distribution. In other words, the same proportion will be in the left and right tails.
This should result in the following output:
To find the total proportion of the z distribution that is more extreme than a z value of ±2 we need to add together the area in the two tails:
0.02275 + 0.02275 = 0.0455
The area that is more than two standard deviations from the mean on a normal distribution is 0.0455, or 4.55%.
Minitab®
Question: Vehicle speeds at a highway location have a normal distribution with a mean of 65 mph and a standard deviation of 5 mph. What proportion of vehicles are deviating from the mean by 10 mph or more? In other words, what proportion are going less than 55 mph or more than 75 mph?
Let's construct a normal distribution with a mean of 65 and standard deviation of 5 to find the area more than 10 mph from the mean.
- From the tool bar select Graph > Probability Distribution Plot > One Curve > View Probability
- Change the Mean to 65 and the Standard deviation to 5
- Select Options
- Select A specified x value
- Select Equal Tails
- For X value enter 55 or 75*
- Click Ok
- Click Ok
* By default, "equal tails" will result in a symmetric distribution. In other words, the same proportion will be in the left and right tails.
This should result in the following output:
To find the total proportion of vehicles that are deviating from the mean by 10 mph or more we need to add together the area in the two tails:
0.02275 + 0.02275 = 0.0455
The proportion of vehicles deviating from the mean by 10 mph or more is 0.0455, or 4.55%.