8.2.3.1.4 - Example: Transportation Costs
8.2.3.1.4 - Example: Transportation CostsAccording to CNN, in 2011, the average American spent \$16,803 on housing. A suburban community wants to know if their residents spent less than this national average. In a survey of 30 randomly selected residents, they found that they spent an annual average of \$15,800 with a standard deviation of \$2,600.
Housing costs are quantitative. Because \(n \ge 30\), the sampling distribution can be approximated using the \(t\) distribution.
This is a left-tailed test because we want to know if residents of this community spent less than the national average.
\(H_{0}:\mu=16803\)
\(H_{a}:\mu<16803\)
- Test Statistic: One Group Mean
-
\(t=\dfrac{\overline{x}-\mu_0}{\dfrac{s}{\sqrt{n}}}\)
\(\overline{x}\) = sample mean
\(\mu_{0}\) = hypothesized population mean
\(s\) = sample standard deviation
\(n\) = sample size
\(t=\dfrac{\overline{x}-\mu_0}{\dfrac{s}{\sqrt{n}}}=\dfrac{15800-16803}{\dfrac{2600}{\sqrt{30}}}=-2.113\)
Our t test statistics is -2.113
\(df=n-1=30-1=29\)
This is a left-tailed test so we want to know the probability of \(t < -2.113\)
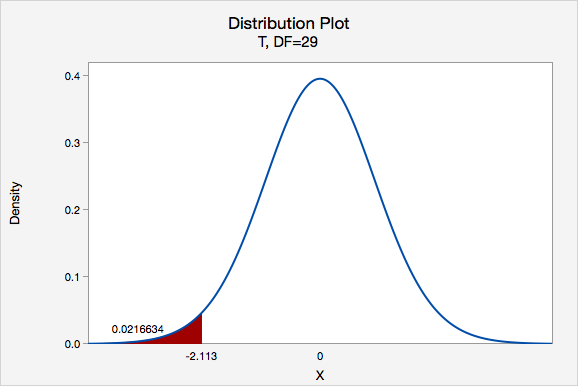
Using Minitab we can find that \(p=0.0216634\)
\(p\leq .05\), therefore we reject the null hypothesis.
There is evidence to state that on average residents of this community spent less than the national average on housing in 2011.