10.5 - Example: SAT-Math Scores by Award Preference
10.5 - Example: SAT-Math Scores by Award PreferenceIn this example, we are comparing the SAT scores of students who said that they would prefer to win an Academy Award, a Nobel Prize, or an Olympic gold medal.
The example uses the StudentSurvey dataset provided by the Lock5 textbook.
Let's apply the five-step hypothesis testing process to this example.
The assumptions for a one-way between-groups ANOVA are:
Assumption: Samples are independent: Each student selected either Olympic, Academy, or Nobel. Each student is in only one group and those groups are in no way matched or paired. This assumption is met.
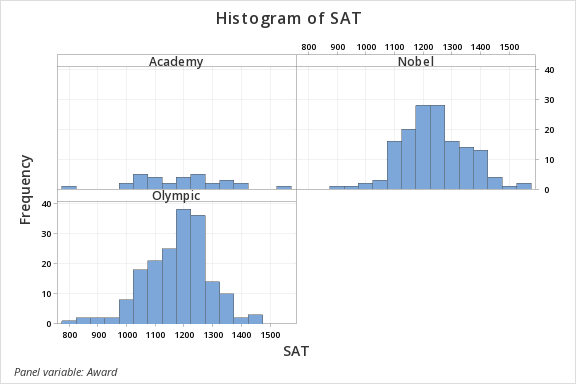
Assumption: The response variable is approximately normally distributed for each group or all group sample sizes are at least 30: To check this we can construct a histogram with groups in Minitab. These plots show that the distributions are all approximately normal.
Assumption: The population variances are equal across responses for the group levels (if the largest sample standard deviation divided by the smallest sample standard deviation is not greater than two, then assume that the population variances are equal). Again we can use Minitab to look at the standard deviations across the groups. The largest standard deviation is 151.3 and the smallest is 114.1 for a ratio of 1.33 which is less than 2. So this assumption is met.
Statistics
Award | N | N* | Mean | SE Mean | StDev | Minimum | Q1 | Median | Q3 | Maximum |
|---|---|---|---|---|---|---|---|---|---|---|
Academy | 31 | 0 | 1191.0 | 27.2 | 151.3 | 820.0 | 1070.0 | 1200.0 | 1300.0 | 1530.0 |
Nobel | 149 | 0 | 1239.1 | 9.38 | 114.5 | 920.0 | 1160.0 | 1230.0 | 1310.0 | 1550.0 |
Olympic | 182 | 0 | 1176.7 | 8.46 | 114.1 | 800.0 | 1100.0 | 1190.0 | 1250.0 | 1470.0 |
Use Minitab to run a one-way ANOVA with the Minitab file: StudentSurvey.mpx
The following will describe the output within the context of the five-step hypothesis testing process.
Given that you are comparing \(k\) independent groups, the null and alternative hypotheses are:
Method
Null hypothesis | All means are equal |
|---|---|
Alternative hypothesis | At least one mean is different |
Significance level | \(\alpha=0.05\) |
Equal variances were assumed for the analysis
You should get the following output:
Factor Information
Factor | Levels | Values |
|---|---|---|
Award | 3 | Academy, Nobel, Olympic |
The factor information tells us that our factor is the Award.
Analysis of Variance
Source | DF | Adj SS | Adj MS | F-Value | P-Value |
|---|---|---|---|---|---|
Award | 2 | 323269 | 162134 | 11.67 | 0.000 |
Error | 359 | 4986078 | 13889 | ||
Total | 361 | 5310347 |
The analysis of variance table is also known as our ANOVA source table. The source of the Award is our between-groups variation so the DF K -1 or 3-1 = 2. Error is our within-groups variation so the degrees of freedom are n - K or 362-3 = 359. The 'Adj' stands for adjusted. For a one-way ANOVA, nothing is being adjusted. The F-value is our F-test statistic, which in this case is 11.67 with a p-value of 0.000. The F value could be written as F (2, 359) = 11.67.
Means
Factor | N | Mean | StDev | 95% CI |
|---|---|---|---|---|
Academy | 31 | 1191.0 | 151.3 | (1149.3, 1232.6) |
Nobel | 149 | 1239.11 | 114.54 | (1220.13, 1258.10) |
Olympic | 182 | 1176.73 | 114.13 | (1159.55, 1193.91) |
Pooled StDev = 117.851
The Means table is just a table of descriptive statistics. The sample size, mean, and the standard deviation is presented for each group. The last column is an unadjusted 95% confidence interval. You should not refer to these confidence intervals since these do not take into account that there are three different groups and three different confidence intervals being computed at the same time. The confidence intervals that we're interested in come with our Tukey pairwise comparison.
need to know two of these degrees of freedom: \(df_1 = df_{between}\) and \(df_2=df_{within}\).
The p-value is 0.000 from the Minitab output.
\(p \leq \alpha\) so reject the null hypothesis.
We can conclude that the group means are not all equal.
Remember that ANOVA is just an omnibus test. It only tells us there is a difference somewhere. To determine where the differences are you would have to look at the Tukey pairwise comparison output.
Grouping Information Using the Tukey Method and 95% Confidence
Award | N | Mean | Grouping | |
|---|---|---|---|---|
Nobel | 149 | 1239.11 | A | |
Academy | 31 | 1190.97 | A | B |
Olympic | 182 | 1176.73 | B | |
Means that do not share a letter are significantly different.
In the grouping table, Nobel and Olympic do not share a grouping letter. The means of these two groups are significantly different. Both the Nobel and Academy belong to Group A and both Academy and Olympic belong to Group B. These pairs are not significantly different.
Tukey Simultaneous Tests for Differences of Means
Difference of Levels | Difference | SE of | 95% CI | T-Value | Adjusted |
|---|---|---|---|---|---|
Nobel - Academy | 48.1 | 23.3 | (-6.3, 102.6) | 2.07 | 0.096 |
Olympic - Academy | -14.2 | 22.9 | (-67.8, 39.4) | -0.62 | 0.808 |
Olympic - Nobel | -62.4 | 13.0 | (-92.9, -31.9) | -4.79 | 0.000 |
Individual confidence level = 98.87%
The Tukey Simultaneous Tests table provides the adjusted 95% confidence intervals. These are the confidence intervals and p-values you should be looking at when you're making pairwise comparisons. These are adjusted to take into account that there are three different pairwise tests being performed simultaneously. To determine which groups are statistically significant we can look at the adjusted p-value. In this case, the only p-value less than 0.05 is the Olympic - Nobel pairwise comparison. The means of the Olympic and Nobel group are significantly different.
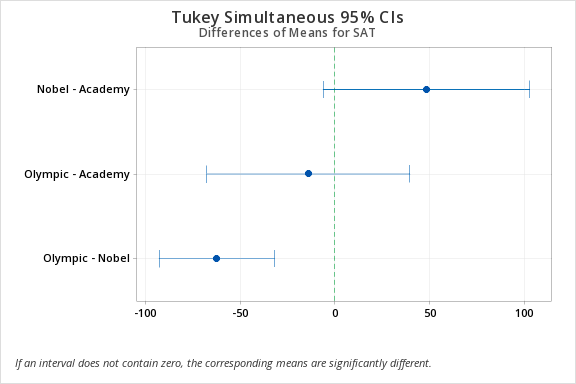
In the Tukey Simultaneous 95% CI graph any interval not containing zero indicates a statistically significant difference. In this case, we see that the Olympic - Nobel group does not contain zero so this pairing has a statistically significant difference.