11.1.3 - Probability Distribution Plots
11.1.3 - Probability Distribution PlotsIn previous lessons you have constructed probabilities distribution plots for normal distributions, binomial distributions, and \(t\) distributions. This week you will use the same procedure to construct a probability distribution plot for the chi-square distribution.
Minitab® – Constructing a Probability Distribution Plot
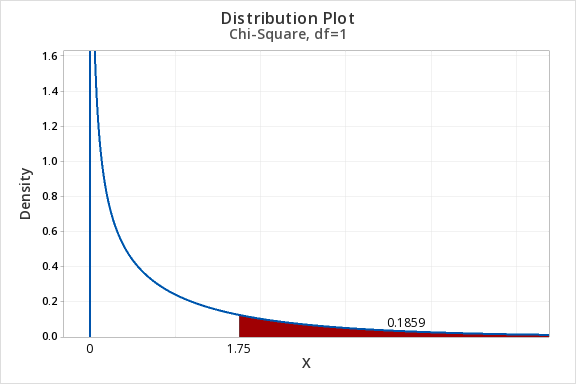
Chi-square tests of independence are always right-tailed tests. Let's find the area of a chi-square distribution with 1 degree of freedom to the right of \(\chi^2 = 1.75\). In other words, we're looking up the \(p\) value associated with a chi-square test statistic of 1.75.
- In Minitab, select Graph > Probability Distribution Plot > View Probability
- Choose Chi-Square for the Distribution
- For Distribution select Chi-Square
- For Degrees of freedom enter 1
- Select A specified X value
- Select Right tail
- For X value enter 1.75
- Select OK and OK
This should result in the following output:
Example: Area to the Right of Chi-Sq = 6.25, df=3
Construct a chi-square distribution with 3 degrees of freedom to find the area to the right of a chi-square value of 6.25.
- In Minitab, select Graph > Probability Distribution Plot > View Probability
- Choose Chi-Square for the Distribution
- For Distribution select Chi-Square
- For Degrees of freedom enter 3
- Select A specified X value
- Select Right tail
- For X value enter 6.25
- Select OK and OK
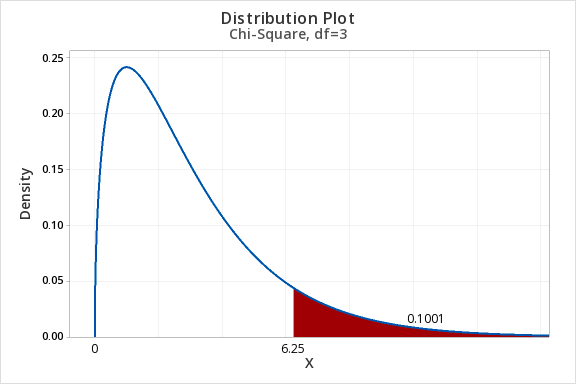
The area to the right of 6.25 in the chi-square distribution with 3 degrees of freedom is 0.1001.