11.3.1 - Example: Gender and Online Learning
11.3.1 - Example: Gender and Online LearningGender and Online Learning
A sample of 314 Penn State students was asked if they have ever taken an online course. Their genders were also recorded. The contingency table below was constructed. Use a chi-square test of independence to determine if there is a relationship between gender and whether or not someone has taken an online course.
| Have you taken an online course? | ||
|---|---|---|
| Yes | No | |
| Men | 43 | 63 |
| Women | 95 | 113 |
Solution
\(H_0:\) There is not a relationship between gender and whether or not someone has taken an online course (they are independent)
\(H_a:\) There is a relationship between gender and whether or not someone has taken an online course (they are dependent)
Looking ahead to our calculations of the expected values, we can see that all expected values are at least 5. This means that the sampling distribution can be approximated using the \(\chi^2\) distribution.
In order to compute the chi-square test statistic we must know the observed and expected values for each cell. We are given the observed values in the table above. We must compute the expected values. The table below includes the row and column totals.
| Have you taken an online course? | |||
|---|---|---|---|
| Yes | No | ||
| Men | 43 | 63 | 106 |
| Women | 95 | 113 | 208 |
| 138 | 176 | 314 | |
| \(E=\dfrac{row\;total \times column\;total}{n}\) |
| \(E_{Men,\;Yes}=\dfrac{106\times138}{314}=46.586\) |
| \(E_{Men,\;No}=\dfrac{106\times176}{314}=59.414\) |
| \(E_{Women,\;Yes}=\dfrac{208\times138}{314}=91.414\) |
| \(E_{Women,\;No}=\dfrac{208 \times 176}{314}=116.586\) |
Note that all expected values are at least 5, thus this assumption of the \(\chi^2\) test of independence has been met.
Observed and expected counts are often presented together in a contingency table. In the table below, expected values are presented in parentheses.
| Have you taken an online course? | |||
|---|---|---|---|
| Yes | No | ||
| Men | 43 (46.586) | 63 (59.414) | 106 |
| Women | 95 (91.414) | 113 (116.586) | 208 |
| 138 | 176 | 314 | |
\(\chi^2=\sum \dfrac{(O-E)^2}{E} \)
\(\chi^2=\dfrac{(43-46.586)^2}{46.586}+\dfrac{(63-59.414)^2}{59.414}+\dfrac{(95-91.414)^2}{91.414}+\dfrac{(113-116.586)^2}{116.586}=0.276+0.216+0.141+0.110=0.743\)
The chi-square test statistic is 0.743
\(df=(number\;of\;rows-1)(number\;of\;columns-1)=(2-1)(2-1)=1\)
We can determine the p-value by constructing a chi-square distribution plot with 1 degree of freedom and finding the area to the right of 0.743.
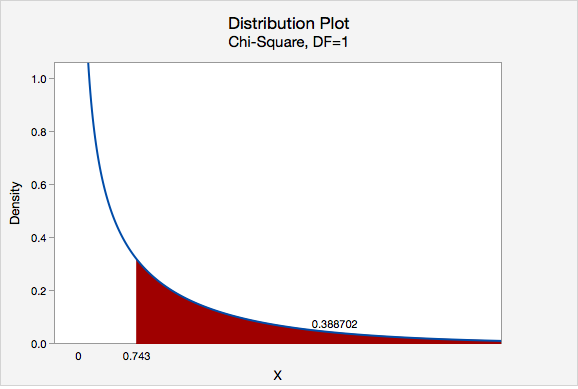
\(p = 0.388702\)
\(p>\alpha\), therefore we fail to reject the null hypothesis.
There is not enough evidence to conclude that gender and whether or not an individual has completed an online course are related.
Note that we cannot say for sure that these two categorical variables are independent, we can only say that we do not have enough evidence that they are dependent.