2.2.6 - Minitab: Central Tendency & Variability
2.2.6 - Minitab: Central Tendency & VariabilityMinitab may be used to compute descriptive statistics for numeric variables, including the mean, median, mode, standard deviation, and variance.
Note that these are the default setting in Minitab:
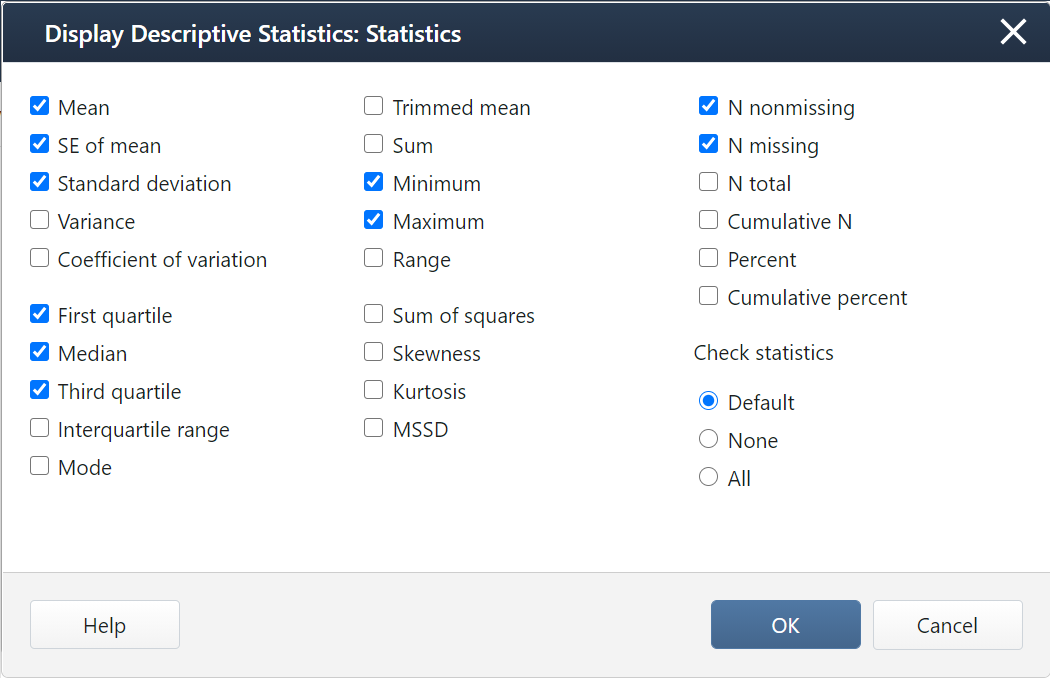
If you want additional statistics, such as the mode, variance, range, or interquartile range (IQR), you will need to select them in the Statistics window.
Minitab® – Central Tendency
Central Tendency and Variability
This example will use data collected from a sample of students enrolled in online sections of STAT 200 during the Summer 2020 semester. These data can be downloaded as a CSV file:
To obtain measures of central tendency and variability in Minitab:
- Open the data set in Minitab
- From the tool bar, select Stat > Basic Statistics > Display Descriptive Statistics...
- Double click the variable Online Courses Completed in the box on the left to insert it into the Variables box on the right
- Click on the Statistics button and select the descriptive statistics you want displayed (e.g., Variance, Interquartile range, Mode)
- Click OK
- Click OK
This should result in the following output:
Descriptive Statistics: Online Courses Completed
| Variable | N | N* | Mean | SE Mean | StDev | Variance | Minimum | Q1 | Median | Q3 | Maximum | IQR | Mode | N for Mode |
|---|---|---|---|---|---|---|---|---|---|---|---|---|---|---|
| Online Courses Completed | 324 | 19 | 5.6975 | 0.4579 | 8.2429 | 67.945 | 0.0000 | 1.0000 | 3.0000 | 6.0000 | 70.0000 | 5.000 | 0 | 57 |
Video Walkthrough