Here we will examine a few important issues related to correlation and regression: the impact of outliers, extrapolation, and the interpretation of causation.
Influence of Outliers Section
An outlier may decrease or increase a correlation value. Below, in the first plot there are no outliers. In the second and third plots, each have one outlier. Depending on the location of the outlier, the correlation could be decreased or increased.


When the point (90, 0) was added, the correlation decreased from r = 0.825 to r = 0.343. This decrease occurred because the outlier was not in line with the pattern of the other points.

When the point (0, 0) was added, the correlation increased from r = 0.825 to r = 0.972. This increase occurred because the outlier was in line with the pattern of the other points.
Extrapolation Section
A regression equation should not be used to make predictions for values that are far from those that were used to construct the model or for those that come from a different population. This misuse of regression is known as extrapolation.
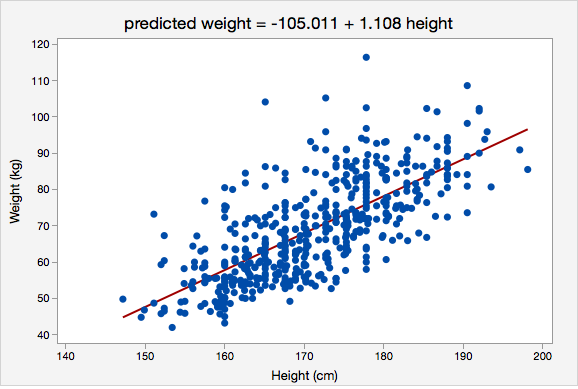
For example, the regression line below was constructed using data from adults who were between 147 and 198 centimeters tall. It would not be appropriate to use this regression model to predict the height of a child. For one, children are a different population and were not included in the sample that was used to construct this model. And second, the height of a child will likely not fall within the range of heights used to construct this regression model. If we wanted to use height to predict weight in children, we would need to obtain a sample of children and construct a new model.

Interpretation of Causation Section
Recall from earlier in the course, correlation does not equal causation. To establish causation one must rule out the possibility of lurking variables. The best method to accomplish this is through a solid design of your experiment, preferably one that uses a control group and randomization methods.
For example, consider smoking cigarettes and lung cancer. Does smoking cause lung cancer? Initially this was answered as yes, but this was based on a strong correlation between smoking and lung cancer. Not until scientific research verified that smoking can lead to lung cancer was causation established. If you were to review the history of cigarette warning labels, the first mandated label only mentioned that smoking was hazardous to your health. Not until 1981 did the label mention that smoking causes lung cancer.