Ut enim ad minim veniam, quis nostrud exercitation ullamco laboris
Duis aute irure dolor in reprehenderit in voluptate
Excepteur sint occaecat cupidatat non proident
Lorem ipsum dolor sit amet, consectetur adipisicing elit. Odit molestiae mollitia
laudantium assumenda nam eaque, excepturi, soluta, perspiciatis cupiditate sapiente, adipisci quaerat odio
voluptates consectetur nulla eveniet iure vitae quibusdam? Excepturi aliquam in iure, repellat, fugiat illum
voluptate repellendus blanditiis veritatis ducimus ad ipsa quisquam, commodi vel necessitatibus, harum quos
a dignissimos.
Keyboard Shortcuts
Help
F1 or
?
Previous Page
← +
CTRL (Windows)
← +
⌘ (Mac)
Next Page
→ +
CTRL (Windows)
→ +
⌘ (Mac)
Search Site
CTRL +
SHIFT +
F (Windows)
⌘ +
⇧ +
F (Mac)
Close Message
ESC
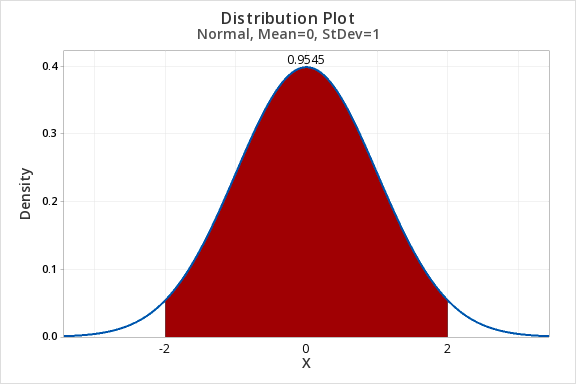
7.2.3.1 - Example: Proportion Between z -2 and +2
Question: What proportion of the z distribution is between -2 and 2?
Steps
In Minitab select Graph > Probability Distribution Plot > One Curve > View Probability, hit OK.
Select Normal and enter 0 for the mean and 1 for the standard deviation.(Note: The default is the standard normal distribution)
Select Options
Select A specified x value
Select Middle and enter
X value 1: -2
X value 2: 2
Select OK
The proportion of the z distributions that falls between -2 and 2 is 0.9545.