5.2 - Two Proportions
5.2 - Two ProportionsExample 5-2
Let's start our exploration of finding a confidence interval for the difference in two proportions by way of an example.
What is the prevalence of anemia in developing countries?
| African Women | Women from Americas | |
| Sample size | 2100 | 1900 |
| Number with anemia | 840 | 323 |
| Sample proportion | \(\dfrac{840}{2100}=0.40\) | \(\dfrac{323}{1900}=0.17\) |
Find a 95% confidence interval for the difference in proportions of all African women with anemia and all women from the Americas with anemia.
Answer
Let's start by simply defining some notation. Let:
- \(n_1\) = the number of African women sampled = 2100
- \(n_2\) = the number of women from the Americas sampled = 1900
- \(y_1\) = the number of African women with anemia = 840
- \(y_2\) = the number of women from the Americas with anemia = 323
Based on these data, we can calculate two sample proportions. The proportion of African women sampled who have anemia is:
\(\hat{p}_1=\dfrac{840}{2100}=0.40\)
And the proportion of women from the Americas sampled who have anemia is:
\(\hat{p}_2=\dfrac{323}{1900}=0.17\)
Now, letting:
- \(p_1\) = the proportion of all African women with anemia
- \(p_2\) = the proportion of all women from the Americas with anemia
we are then interested in finding a 95% confidence interval for \(p_1-p_2\), the difference in the two population proportions. We need to derive a formula for the confidence interval before we can actually calculate it!
Theorem
For large random samples, an (approximate) \((1-\alpha)100\%\) confidence interval for \(p_1-p_2\), the difference in two population proportions, is:
\((\hat{p}_1-\hat{p}_2)\pm z_{\alpha/2} \sqrt{\dfrac{\hat{p}_1(1-\hat{p}_1)}{n_1}+\dfrac{\hat{p}_2(1-\hat{p}_2)}{n_2}}\)
Proof
Let's start with what we know from previous work, namely:
\(\hat{p}_1=\dfrac{Y_1}{n_1} \sim N\left(p_1,\dfrac{p_1(1-p_1)}{n_1}\right)\) and \(\hat{p}_2=\dfrac{Y_2}{n_2} \sim N\left(p_2,\dfrac{p_2(1-p_2)}{n_2}\right)\)
By independence, therefore:
\((\hat{p}_1-\hat{p}_2) \sim N\left(p_1-p_2,\dfrac{p_1(1-p_1)}{n_1}+\dfrac{p_2(1-p_2)}{n_2}\right)\)
Now, it's just a matter of transforming the inside of the typical probability statement:
\(P\left[-z_{\alpha/2} \leq \dfrac{(\hat{p}_1-\hat{p}_2)-(p_1-p_2)}{\sqrt{\dfrac{p_1(1-p_1)}{n_1}+\dfrac{p_2(1-p_2)}{n_2}}} \leq z_{\alpha/2} \right] \approx 1-\alpha\)
That is, we start with this:
\(-z_{\alpha/2} \leq \dfrac{(\hat{p}_1-\hat{p}_2)-(p_1-p_2)}{\sqrt{\dfrac{p_1(1-p_1)}{n_1}+\dfrac{p_2(1-p_2)}{n_2}}} \leq z_{\alpha/2}\)
Multiplying through the inequality by the quantity in the denominator, we get:
\(-z_{\alpha/2}\sqrt{\dfrac{p_1(1-p_1)}{n_1}+\dfrac{p_2(1-p_2)}{n_2}}\leq (\hat{p}_1-\hat{p}_2)-(p_1-p_2) \leq z_{\alpha/2}\sqrt{\dfrac{p_1(1-p_1)}{n_1}+\dfrac{p_2(1-p_2)}{n_2}}\)
Subtracting through the inequality by \(\hat{p}_1-\hat{p}_2\), we get:
\(-(\hat{p}_1-\hat{p}_2)-z_{\alpha/2}\sqrt{\dfrac{p_1(1-p_1)}{n_1}+\dfrac{p_2(1-p_2)}{n_2}}\leq -(p_1-p_2) \leq -(\hat{p}_1-\hat{p}_2)+z_{\alpha/2}\sqrt{\dfrac{p_1(1-p_1)}{n_1}+\dfrac{p_2(1-p_2)}{n_2}}\)
And finally, dividing through the inequality by −1, and rearranging the inequalities, we get our confidence interval:
\((\hat{p}_1-\hat{p}_2)-z_{\alpha/2}\sqrt{\dfrac{p_1(1-p_1)}{n_1}+\dfrac{p_2(1-p_2)}{n_2}}\leq p_1-p_2 \leq (\hat{p}_1-\hat{p}_2)+z_{\alpha/2}\sqrt{\dfrac{p_1(1-p_1)}{n_1}+\dfrac{p_2(1-p_2)}{n_2}}\)
Ooooppps again! What's wrong with the interval? That's right... we need to know the two population proportions in order the estimate the difference in the population proportions!!
That clearly won't work! We can again solve the problem by putting some hats on those population proportions! Doing so, we get the (approximate) \((1-\alpha)100\%\) confidence interval for \(p_1-p_2\):
\((\hat{p}_1-\hat{p}_2)-z_{\alpha/2}\sqrt{\dfrac{\hat{p}_1(1-\hat{p}_1)}{n_1}+\dfrac{\hat{p}_2(1-\hat{p}_2)}{n_2}}\leq p_1-p_2 \leq (\hat{p}_1-\hat{p}_2)+z_{\alpha/2}\sqrt{\dfrac{\hat{p}_1(1-\hat{p}_1)}{n_1}+\dfrac{\hat{p}_2(1-\hat{p}_2)}{n_2}}\)
as claimed.
Example 5-2 (continued)

What is the prevalence of anemia in developing countries?
| African Women | Women from Americas | |
| Sample size | 2100 | 1900 |
| Number with anemia | 840 | 323 |
| Sample proportion | \(\dfrac{840}{2100}=0.40\) | \(\dfrac{323}{1900}=0.17\) |
Find a 95% confidence interval for the difference in proportions of all African women with anemia and all women from the Americas with anemia.
Substituting in the numbers that we know into the formula for a 95% confidence interval for \(p_1-p_2\), we get:
\((0.40-0.17)\pm 1.96 \sqrt{\dfrac{0.40(0.60)}{2100}+\dfrac{0.17(0.83)}{1900}}\)
which simplifies to:
\(0.23\pm 0.027=(0.203, 0.257)\)
We can be 95% confident that there are between 20.3% and 25.7% more African women with anemia than women from the Americas with anemia.
Example 5-3

A social experiment conducted in 1962 involved \(n=123\) three- and four-year-old children from poverty-level families in Ypsilanti, Michigan. The children were randomly assigned either to:
- A treatment group receiving two years of preschool instruction
- A control group receiving no preschool instruction.
The participants were followed into their adult years. Here is a summary of the data:
| Arrested for some crime | ||
| Yes | No | |
| Control | 32 | 30 |
| Preschool | 19 | 42 |
Find a 95% confidence interval for \(p_1-p_2\), the difference in the two population proportions.
Answer
Of the \(n_1=62\) children serving as the control group, 32 were later arrested for some crime, yielding a sample proportion of:
\(\hat{p}_1=0.516\)
And, of the \(n_2=61\) children receiving preschool instruction, 19 were later arrested for some crime, yielding a sample proportion of:
\(\hat{p}_2=0.311\)
A 95% confidence interval for \(p_1-p_2\) is therefore:
\((0.516-0.311)\pm 1.96\sqrt{\dfrac{0.516(0.484)}{62}+\dfrac{0.311(0.689)}{61}}\)
which simplifies to:
\(0.205\pm 0.170=(0.035, 0.375)\)
We can be 95% confident that between 3.5% and 37.5% more children not having attended preschool were arrested for a crime by age 19 than children who had received preschool instruction.
Minitab®
Using Minitab
Yes, Minitab will calculate a confidence interval for the difference in two population proportions for you. To do so:
-
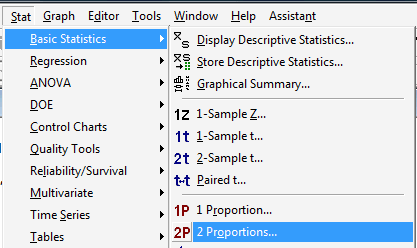
Under the Stat menu, select Basic Statistics, and then select 2 Proportions...:

-
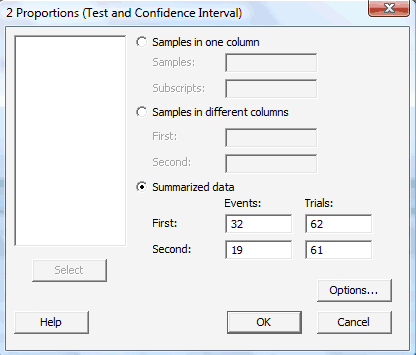
In the pop-up window that appears, select Summarized data, and enter the Number of events, as well as the Number of Trials (that is, the sample sizes \(n_i\)) for each of two groups (First and Second) of interest:

-
Select OK. The output should appear in the Session window:
| Sample | X | N | Sample p |
|---|---|---|---|
| 1 | 32 | 62 | 0.516129 |
| 2 | 19 | 61 | 0.311475 |
Difference = p (1) - p (2)
Estimate for difference: 0.204654
95% CI for difference: (0.0344211, 0.374886)
Test for difference = 0 (vs not =0): Z = 2.36 P-Value = 0.018
Fisher's exact test: P-Value = 0.028