9.5 - Using Minitab
9.5 - Using MinitabHypothesis Test for a Single Proportion
To illustrate how to tell Minitab to perform a Z-test for a single proportion, let's refer to the lung cancer example that appeared on the page called The P-Value Approach.
-
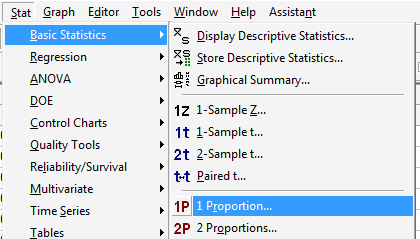
Under the Stat menu, select Basic Statistics, and then 1 Proportion...:
-
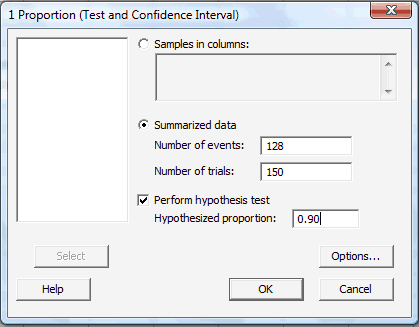
In the pop-up window that appears, click on the radio button labeled Summarized data. In the box labeled Number of events, type in the number of successes or events of interest, and in the box labeled Number of trials, type in the sample size n. Click on the box labeled Perform hypothesis test, and in the box labeled Hypothesized proportion, type in the value of the proportion assumed in the null hypothesis:
-
Click on the button labeled Options... In the pop-up window that appears, for the box labeled Alternative, select either less than, greater than, or not equal depending on the direction of the alternative hypothesis. Click on the box labeled Use test and interval based on normal distribution:
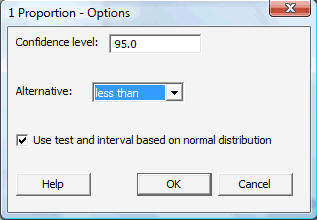
Then, click OK to return to the main pop-up window.
-
Then, upon clicking OK on the main pop-up window, the output should appear in the Session window:
Test of P = 0.9 vs p < 0.9 Sample X N Sample P 95% Upper Bound Z-Value P-Value 1 128 150 0.853333 0.900846 -1.91 0.028 Using the normal approximation.
As you can see, Minitab reports not only the value of the test statistic (Z = −1.91) but also the P-value (0.028) and the 95% confidence interval (one-sided in this case, because of the one-sided hypothesis).
Hypothesis Test for Comparing Two Proportions
To illustrate how to tell Minitab to perform a Z-test for comparing two population proportions, let's refer to the smoker survey example that appeared on the page called Comparing Two Proportions.
-
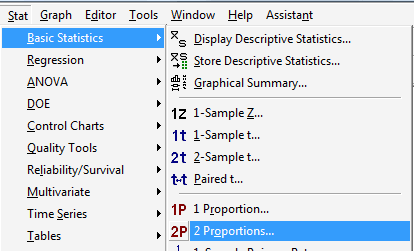
Under the Stat menu, select Basic Statistics, and then 2 Proportions...:
-
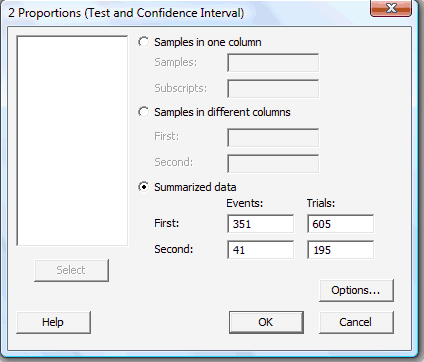
In the pop-up window that appears, click on the radio button labeled Summarized data. In the boxes labeled Events, type in the number of successes or events of interest for both the First and Second samples. And in the boxes labeled Trials, type in the size \(n_1\) of the First sample and the size \(n_2\) of the Second sample:
-
Click on the button labeled Options... In the pop-up window that appears, in the box labeled Test difference, type in the assumed value of the difference in the proportions that appears in the null hypothesis. The default value is 0.0, the value most commonly assumed, as it means that we are interested in testing for the equality of the population proportions. For the box labeled Alternative, select either less than, greater than, or not equal depending on the direction of the alternative hypothesis. Click on the box labeled Use pooled estimate of p for test:
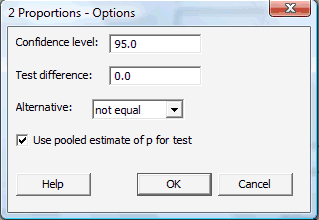
Then, click OK to return to the main pop-up window.
-
Then, upon clicking OK on the main pop-up window, the output should appear in the Session window:
Sample X N Sample P 1 351 605 0.580165 2 41 195 0.210256 Difference = p (1) - p (2)
Estimate for difference: 0.369909
95% CI for difference: (0.0300499, 0.439319)
T-Test of difference = 0 (vs not =0): Z = 8.99 P-Value = 0.000
Fischer's exact test: P-Value = 0.000Again, as you can see, Minitab reports not only the value of the test statistic (Z = 8.99) but other useful things as well, including the P-value, which in this case is so small as to be deemed to be 0.000 to three digits. For scientific reporting purposes, we would typically write that as P < 0.0001.