10.4 - Using Minitab
10.4 - Using MinitabZ-Test for a Single Mean
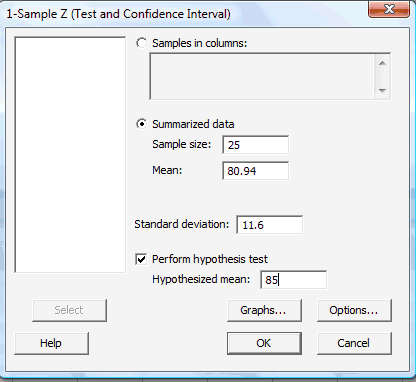
To illustrate how to tell Minitab to perform a Z-test for a single mean, let's refer to the boys weight example that appeared on the page called The Z-test: When Population Variance is Known.
-
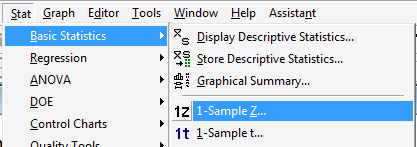
Under the Stat menu, select Basic Statistics, and then 1-Sample Z...:
-
In the pop-up window that appears, click on the radio button labeled Summarized data. In the box labeled Sample size, type in the sample size n, and in the box labeled Mean, type in the sample mean. In the box labeled Standard deviation, type in the value of the known (or rather assumed!) population standard deviation. Click on the box labeled Perform hypothesis test, and in the box labeled Hypothesized mean, type in the value of the mean assumed in the null hypothesis:
-
Click on the button labeled Options... In the pop-up window that appears, for the box labeled Alternative, select either less than, greater than, or not equal depending on the direction of the alternative hypothesis:
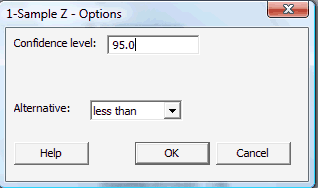
Then, click OK to return to the main pop-up window.
-
Then, upon clicking OK on the main pop-up window, the output should appear in the Session window:
Test of mu = 85 vs < 85
The assumed standard deviation = 11.6N Mean SE Mean 95% Upper Bound Z P 25 80.94 2.32 84.76 -1.75 0.040
T-test for a Single Mean
To illustrate how to tell Minitab to perform a t-test for a single mean, let's refer to the systolic blood pressure example that appeared on the page called The T-test: When Population Variance is Unknown.
-
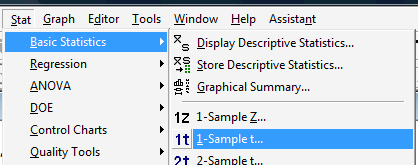
Under the Stat menu, select Basic Statistics, and then 1-Sample t...:
-
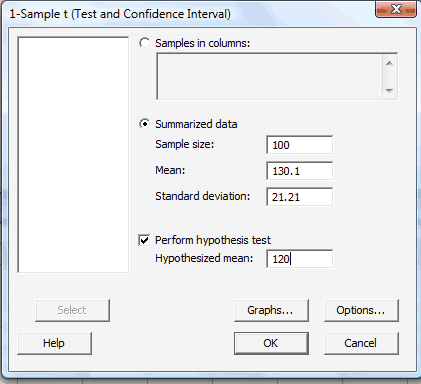
In the pop-up window that appears, click on the radio button labeled Summarized data. In the box labeled Sample size, type in the sample size n; in the box labeled Mean, type in the sample mean; and in the box labeled Standard deviation, type in the sample standard deviation. Click on the box labeled Perform hypothesis test, and in the box labeled Hypothesized mean, type in the value of the mean assumed in the null hypothesis:
-
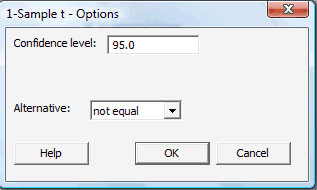
Click on the button labeled Options... In the pop-up window that appears, for the box labeled Alternative, select either less than, greater than, or not equal depending on the direction of the alternative hypothesis:
Then, click OK to return to the main pop-up window.
-
Then, upon clicking OK on the main pop-up window, the output should appear in the Session window:
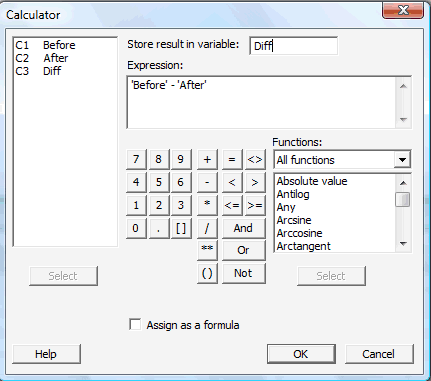
Test of mu = 120 vs not = 120 N Mean StDev SE Mean 95% CI T P 100 130.10 21.21 2.12 (125.89, 134.31) 4.76 0.000 (5) Note that a paired t-test can be performed in the same way. The summarized sample data would simply be the summarized differences. The extra step of calculating the differences would be required, however, if your data are the raw measurements from the two dependent samples. That is, if you have two columns containing, say, Before and After measurements for which you want to analyze Diff, their differences, you can use Minitab's calculator (under the Calc menu, select Calculator) to calculate the differences:
-
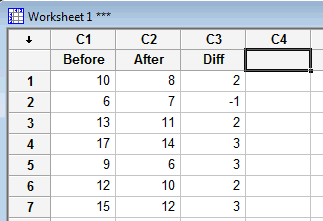
Upon clicking OK, the differences (Diff) should appear in your worksheet:
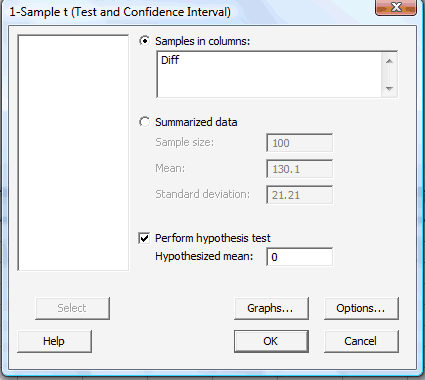
When performing the t-test, you'll then need to tell Minitab (in the Samples in columns box) that the differences are contained in the Diff column:
Here's what the paired t-test output would look like for this example:
One Sample T: Diff
Test of mu = 0 vs not = 0Variable N Mean StDev SE Mean 95% CI T P Diff 7 2.000 1.414 0.535 (0.692, 3.308) 3.74 0.010