11.3 - Using Minitab
11.3 - Using MinitabJust as is the case for asking Minitab to calculate pooled t-intervals and Welch's t-intervals for \(\mu_1-\mu_2\), the commands necessary for asking Minitab to perform a two-sample t-test or a Welch's t-test depend on whether the data are entered in two columns, or the data are entered in one column with a grouping variable in a second column.
Let's recall the spider and prey example, in which the feeding habits of two species of net-casting spiders were studied. The species, the deinopis, and menneus coexist in eastern Australia. The following data were obtained on the size, in millimeters, of the prey of random samples of the two species:
| sample 1 | sample 2 | sample 3 | sample 4 | sample 5 | sample 6 | sample 7 | sample 8 | sample 9 | sample 10 |
|---|---|---|---|---|---|---|---|---|---|
| 12.9 | 10.2 | 7.4 | 7.0 | 10.5 | 11.9 | 7.1 | 9.9 | 14.4 | 11.3 |
| sample 1 | sample 2 | sample 3 | sample 4 | sample 5 | sample 6 | sample 7 | sample 8 | sample 9 | sample 10 |
|---|---|---|---|---|---|---|---|---|---|
| 10.2 | 6.9 | 10.9 | 11.0 | 10.1 | 5.3 | 7.5 | 10.3 | 9.2 | 8.8 |
Let's use the data and Minitab to test whether the mean prey size of the populations of the two types of spiders differs.
When the Data are Entered in Two Columns
-
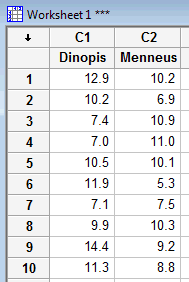
Enter the data in two columns, such as:
-
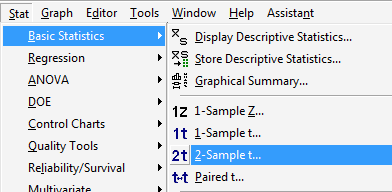
Under the Stat menu, select Basic Statistics, and then select 2-Sample t...:
-
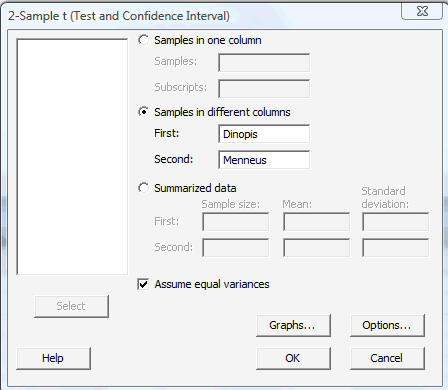
In the pop-up window that appears, select Samples in different columns. Specify the name of the First variable, and specify the name of the Second variable. For the two-sample (pooled) t-test, click on the box labeled Assume equal variances. (For Welch's t-test, leave the box labeled Assume equal variances unchecked.):
-
Click on the button labeled Options... In the pop-up window that appears, for the box labeled Alternative, select either less than, greater than, or not equal depending on the direction of the alternative hypothesis:
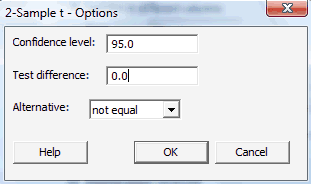
Then, click OK to return to the main pop-up window.
-
Then, upon clicking OK on the main pop-up window, the output should appear in the Session window:
Two-Sample T: For Deinopis vs Menneus Variable N Mean StDev SE Mean Deinopis 10 10.26 2.51 0.79 Menneus 10 9.02 1.90 0.60 Difference = mu (Deinopis) - mu (Menneus)
Estimate for difference: 1.240
95% CI for difference: (-0.852, 3.332)
T-Test of difference = 0 (vs not =): T-Value = 1.25 P-Value = 0.229 DF = 18
Both use Pooled StDev = 2.2266
When the Data are Entered in One Column, and a Grouping Variable in a Second Column
-
Enter the data in one column (called Prey, say), and the grouping variable in a second column (called Group, say, with 1 denoting a deinopis spider and 2 denoting a menneus spider), such as:

-
Under the Stat menu, select Basic Statistics, and then select 2-Sample t...:

-
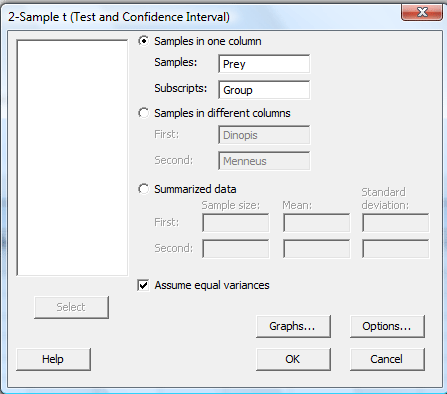
In the pop-up window that appears, select Samples in one column. Specify the name of the Samples variable (Prey, for us) and specify the name of the Subscripts (grouping) variable (Group, for us). For the two-sample (pooled) t-test, click on the box labeled Assume equal variances. (For Welch's t-test, leave the box labeled Assume equal variances unchecked.):
-
Click on the button labeled Options... In the pop-up window that appears, for the box labeled Alternative, select either less than, greater than, or not equal depending on the direction of the alternative hypothesis:

Then, click OK to return to the main pop-up window.
-
Then, upon clicking OK on the main pop-up window, the output should appear in the Session window:
Two-Sample T: For Prey
Group N Mean StDev SE Mean 1 10 10.26 2.51 0.79 2 10 9.02 1.90 0.60 Difference = mu (1) - mu (2)
Estimate for difference: 1.240
95% CI for difference: (-0.852, 3.332)
T-Test of difference = 0 (vs not =): T-Value = 1.25 P-Value = 0.229 DF = 18
Both use Pooled StDev = 2.2266