25.3 - Calculating Sample Size
25.3 - Calculating Sample SizeBefore we learn how to calculate the sample size that is necessary to achieve a hypothesis test with a certain power, it might behoove us to understand the effect that sample size has on power. Let's investigate by returning to our IQ example.
Example 25-3
Let \(X\) denote the IQ of a randomly selected adult American. Assume, a bit unrealistically again, that \(X\) is normally distributed with unknown mean \(\mu\) and (a strangely known) standard deviation of 16. This time, instead of taking a random sample of \(n=16\) students, let's increase the sample size to \(n=64\). And, while setting the probability of committing a Type I error to \(\alpha=0.05\), test the null hypothesis \(H_0:\mu=100\) against the alternative hypothesis that \(H_A:\mu>100\).
What is the power of the hypothesis test when \(\mu=108\), \(\mu=112\), and \(\mu=116\)?
Answer
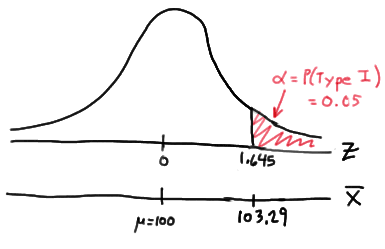
Setting \(\alpha\), the probability of committing a Type I error, to 0.05, implies that we should reject the null hypothesis when the test statistic \(Z\ge 1.645\), or equivalently, when the observed sample mean is 103.29 or greater:
because:
\( \bar{x} = \mu + z \left(\dfrac{\sigma}{\sqrt{n}} \right) = 100 +1.645\left(\dfrac{16}{\sqrt{64}} \right) = 103.29\)
Therefore, the power function \K(\mu)\), when \(\mu>100\) is the true value, is:
\( K(\mu) = P(\bar{X} \ge 103.29 | \mu) = P \left(Z \ge \dfrac{103.29 - \mu}{16 / \sqrt{64}} \right) = 1 - \Phi \left(\dfrac{103.29 - \mu}{2} \right)\)
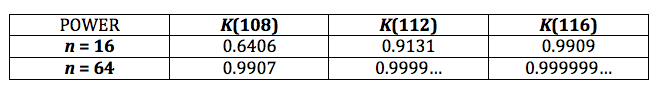
Therefore, the probability of rejecting the null hypothesis at the \(\alpha=0.05\) level when \(\mu=108\) is 0.9907, as calculated here:
\(K(108) = 1 - \Phi \left( \dfrac{103.29-108}{2} \right) = 1- \Phi(-2.355) = 0.9907 \)
And, the probability of rejecting the null hypothesis at the \(\alpha=0.05\) level when \(\mu=112\) is greater than 0.9999, as calculated here:
\( K(112) = 1 - \Phi \left( \dfrac{103.29-112}{2} \right) = 1- \Phi(-4.355) = 0.9999\ldots \)
And, the probability of rejecting the null hypothesis at the \(\alpha=0.05\) level when \(\mu=116\) is greater than 0.999999, as calculated here:
\( K(116) = 1 - \Phi \left( \dfrac{103.29-116}{2} \right) = 1- \Phi(-6.355) = 0.999999... \)
In summary, in the various examples throughout this lesson, we have calculated the power of testing \(H_0:\mu=100\) against \(H_A:\mu>100\) for two sample sizes ( \(n=16\) and \(n=64\)) and for three possible values of the mean ( \(\mu=108\), \(\mu=112\), and \(\mu=116\)). Here's a summary of our power calculations:
As you can see, our work suggests that for a given value of the mean \(\mu\) under the alternative hypothesis, the larger the sample size \(n\), the greater the power \(K(\mu)\). Perhaps there is no better way to see this than graphically by plotting the two power functions simultaneously, one when \(n=16\) and the other when \(n=64\):
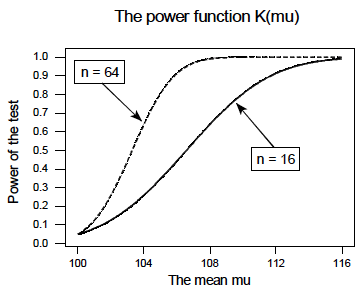
As this plot suggests, if we are interested in increasing our chance of rejecting the null hypothesis when the alternative hypothesis is true, we can do so by increasing our sample size \(n\). This benefit is perhaps even greatest for values of the mean that are close to the value of the mean assumed under the null hypothesis. Let's take a look at two examples that illustrate the kind of sample size calculation we can make to ensure our hypothesis test has sufficient power.
Example 25-4

Let \(X\) denote the crop yield of corn measured in the number of bushels per acre. Assume (unrealistically) that \(X\) is normally distributed with unknown mean \(\mu\) and standard deviation \(\sigma=6\). An agricultural researcher is working to increase the current average yield from 40 bushels per acre. Therefore, he is interested in testing, at the \(\alpha=0.05\) level, the null hypothesis \(H_0:\mu=40\) against the alternative hypothesis that \(H_A:\mu>40\). Find the sample size \(n\) that is necessary to achieve 0.90 power at the alternative \(\mu=45\).
Answer
As is always the case, we need to start by finding a threshold value \(c\), such that if the sample mean is larger than \(c\), we'll reject the null hypothesis:
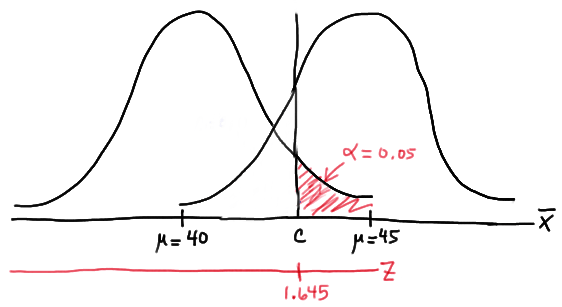
That is, in order for our hypothesis test to be conducted at the \(\alpha=0.05\) level, the following statement must hold (using our typical \(Z\) transformation):
\(c = 40 + 1.645 \left( \dfrac{6}{\sqrt{n}} \right) \) (**)
But, that's not the only condition that \(c\) must meet, because \(c\) also needs to be defined to ensure that our power is 0.90 or, alternatively, that the probability of a Type II error is 0.10. That would happen if there was a 10% chance that our test statistic fell short of \(c\) when \(\mu=45\), as the following drawing illustrates in blue:
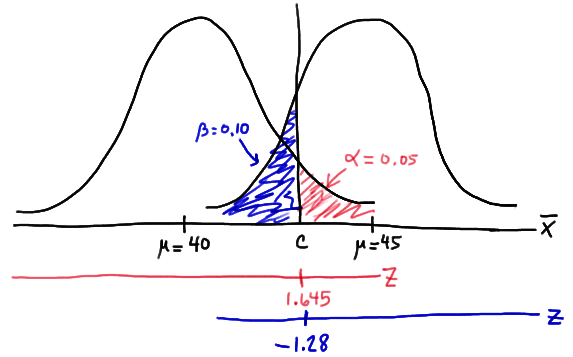
This illustration suggests that in order for our hypothesis test to have 0.90 power, the following statement must hold (using our usual \(Z\) transformation):
\(c = 45 - 1.28 \left( \dfrac{6}{\sqrt{n}} \right) \) (**)
Aha! We have two (asterisked (**)) equations and two unknowns! All we need to do is equate the equations, and solve for \(n\). Doing so, we get:
\(40+1.645\left(\frac{6}{\sqrt{n}}\right)=45-1.28\left(\frac{6}{\sqrt{n}}\right)\)
\(\Rightarrow 5=(1.645+1.28)\left(\frac{6}{\sqrt{n}}\right), \qquad \Rightarrow 5=\frac{17.55}{\sqrt{n}}, \qquad n=(3.51)^2=12.3201\approx 13\)
Now that we know we will set \(n=13\), we can solve for our threshold value c:
\( c = 40 + 1.645 \left( \dfrac{6}{\sqrt{13}} \right)=42.737 \)
So, in summary, if the agricultural researcher collects data on \(n=13\) corn plots, and rejects his null hypothesis \(H_0:\mu=40\) if the average crop yield of the 13 plots is greater than 42.737 bushels per acre, he will have a 5% chance of committing a Type I error and a 10% chance of committing a Type II error if the population mean \(\mu\) were actually 45 bushels per acre.
Example 25-5

Consider \(p\), the true proportion of voters who favor a particular political candidate. A pollster is interested in testing at the \(\alpha=0.01\) level, the null hypothesis \(H_0:9=0.5\) against the alternative hypothesis that \(H_A:p>0.5\). Find the sample size \(n\) that is necessary to achieve 0.80 power at the alternative \(p=0.55\).
Answer
In this case, because we are interested in performing a hypothesis test about a population proportion \(p\), we use the \(Z\)-statistic:
\(Z = \dfrac{\hat{p}-p_0}{\sqrt{\frac{p_0(1-p_0)}{n}}} \)
Again, we start by finding a threshold value \(c\), such that if the observed sample proportion is larger than \(c\), we'll reject the null hypothesis:
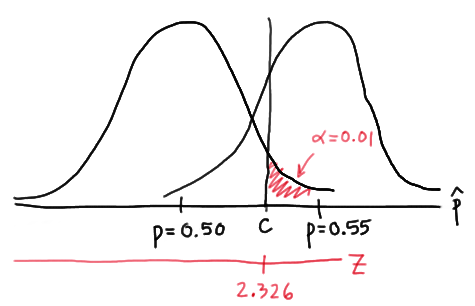
That is, in order for our hypothesis test to be conducted at the \(\alpha=0.01\) level, the following statement must hold:
\(c = 0.5 + 2.326 \sqrt{ \dfrac{(0.5)(0.5)}{n}} \) (**)
But, again, that's not the only condition that c must meet, because \(c\) also needs to be defined to ensure that our power is 0.80 or, alternatively, that the probability of a Type II error is 0.20. That would happen if there was a 20% chance that our test statistic fell short of \(c\) when \(p=0.55\), as the following drawing illustrates in blue:
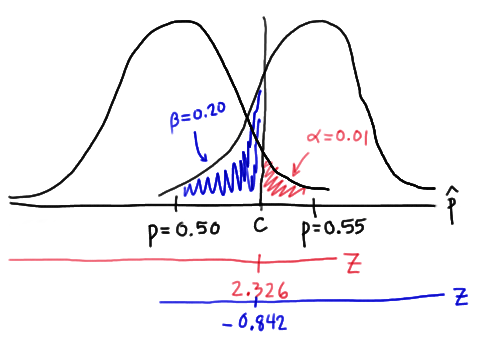
This illustration suggests that in order for our hypothesis test to have 0.80 power, the following statement must hold:
\(c = 0.55 - 0.842 \sqrt{ \dfrac{(0.55)(0.45)}{n}} \) (**)
Again, we have two (asterisked (**)) equations and two unknowns! All we need to do is equate the equations, and solve for \(n\). Doing so, we get:
\(0.5+2.326\sqrt{\dfrac{0.5(0.5)}{n}}=0.55-0.842\sqrt{\dfrac{0.55(0.45)}{n}} \\ 2.326\dfrac{\sqrt{0.25}}{\sqrt{n}}+0.842\dfrac{\sqrt{0.2475}}{\sqrt{n}}=0.55-0.5 \\ \dfrac{1}{\sqrt{n}}(1.5818897)=0.05 \qquad \Rightarrow n\approx \left(\dfrac{1.5818897}{0.05}\right)^2 = 1000.95 \approx 1001 \)
Now that we know we will set \(n=1001\), we can solve for our threshold value \(c\):
\(c = 0.5 + 2.326 \sqrt{\dfrac{(0.5)(0.5)}{1001}}= 0.5367 \)
So, in summary, if the pollster collects data on \(n=1001\) voters, and rejects his null hypothesis \(H_0:p=0.5\) if the proportion of sampled voters who favor the political candidate is greater than 0.5367, he will have a 1% chance of committing a Type I error and a 20% chance of committing a Type II error if the population proportion \(p\) were actually 0.55.
Incidentally, we can always check our work! Conducting the survey and subsequent hypothesis test as described above, the probability of committing a Type I error is:
\(\alpha= P(\hat{p} >0.5367 \text { if } p = 0.50) = P(Z > 2.3257) = 0.01 \)
and the probability of committing a Type II error is:
\(\beta = P(\hat{p} <0.5367 \text { if } p = 0.55) = P(Z < -0.846) = 0.199 \)
just as the pollster had desired.
We've illustrated several sample size calculations. Now, let's summarize the information that goes into a sample size calculation. In order to determine a sample size for a given hypothesis test, you need to specify:
-
The desired \(\alpha\) level, that is, your willingness to commit a Type I error.
-
The desired power or, equivalently, the desired \(\beta\) level, that is, your willingness to commit a Type II error.
-
A meaningful difference from the value of the parameter that is specified in the null hypothesis.
-
The standard deviation of the sample statistic or, at least, an estimate of the standard deviation (the "standard error") of the sample statistic.