22.2 - Two Examples
22.2 - Two ExamplesExample 22-2
We observe the following n = 8 data points:
1.41 0.26 1.97 0.33 0.55 0.77 1.46 1.18
Is there any evidence to suggest that the data were not randomly sampled from a Uniform(0, 2) distribution?
Answer
The probability density function of a Uniform(0, 2) random variable X, say, is:
\( f(x)=\frac{1}{2}\)
for 0 < x < 2. Therefore, the probability that X is less than or equal to x is:
\(P(X \le x) =\int_{0}^{x}\frac{1}{2}dt=\frac{1}{2}x\)
for 0 < x < 2, and we are interested in testing:
- the null hypothesis \(H_0 : F(x)=F_0(x)\) against
- the alternative hypothesis \(H_A : F(x) \ne F_0(x)\)
where F(x) is the (unknown) cdf from which our data were sampled, and
Now, in working towards calculating \(d_n\), we first need to order the eight data points so that \(y_1\le \cdots\le y_8\). The table below provides all the necessary values for finding the KS test statistic. Note that the empirical cdf satisfies \(F_n(y_k)=k/8\), for \(k=0,1,\ldots,8\).
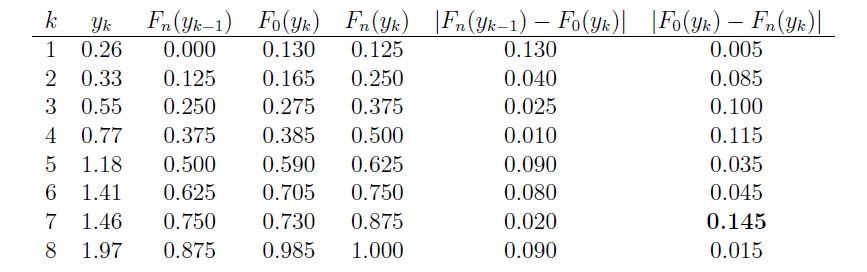
The last two columns represent all the differences we need to check. The largest of these is \(d_8=0.145\). From the table below with \(\alpha=0.05\), the critical value is \(0.46\). So, we can not reject the claim that the data were sampled from Uniform(0,2).
You might recall that the appropriateness of the t-statistic for testing the value of a population mean \(\mu\) depends on the data being normally distributed. Therefore, one of the most common applications of the Kolmogorov-Smirnov test is to see if a set of data does follow a normal distribution. Let's take a look at an example.
Example 22-3

Each person in a random sample of n = 10 employees was asked about X, the daily time wasted at work doing non-work activities, such as surfing the internet and emailing friends. The resulting data, in minutes, are as follows:
108 112 117 130 111 131 113 113 105 128
Is it okay to assume that these data come from a normal distribution with mean 120 and standard deviation 10?
Answer
We are interested in testing the null hypothesis, \(H_0:\) \(X\) is normally distributed with mean 120 and standard deviation 10, against the alternative hypothesis, \(H_A\): \(X\) is not normally distributed with mean 120 and standard deviation 10. Now, in working towards calculating \(d_n\), we again first need to order the ten data points so that \(y_1=105\), \(y_2=108\), etc. Then, we need to calculate the value of the hypothesized distribution function \(F_0(y_k)\) at each of the values of \(y_k\). The standard normal table can help us do this. The probability that \(X\) is less than or equal to 105, for example, equals the probability that \(Z\) is less than or equal to \(-1.5\):
\(F_0(y_1)=P(X\le105)=P\left(Z\le{105-120\over10}\right)=P(Z\le-1.5)=.0668.\)
The table below summarizes the relevant quantities for finding the KS test statistic. Note that the empirical cdf satisfies \(F_n(y_k)=k/10\), except at \(k=5\) because of the tie: \(y_5=y_6=113\).
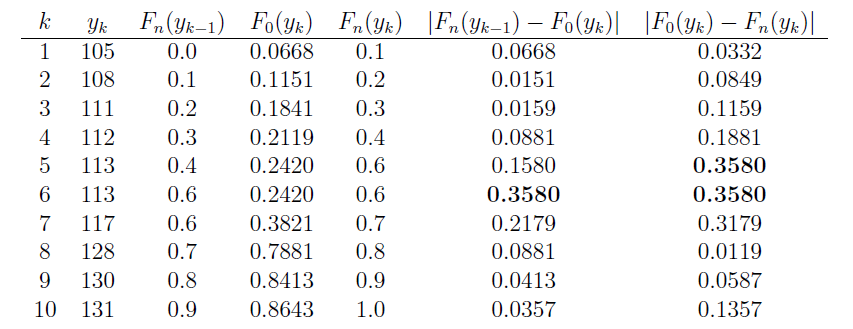
The last two columns represent all the differences we need to check. The largest of these is 0.3580. From the table below with \(\alpha=0.10\), the critical value is 0.37. Because \(d_{10} = 0.358\), which is just barely less than 0.37, we do not reject the null hypothesis at the 0.10 level. There is not enough evidence at the 0.10 level to reject the assumption that the data were randomly sampled from a normal distribution with mean 120 and standard deviation 10.