Lesson 0: Overview
Lesson 0: OverviewWhy study statistics?
To start this course off, a good question to ask might be, "Why Study Statistics?" The American Statistical Association has considered this same question and presents their answer if the form of video interviews of a variety of statisticians. Enjoy!
Why You Need to Study Statistics
Why Study Statistics?
- To evaluate printed numerical facts.
- To interpret the results of sampling or to perform statistical analysis in your work
- To make inferences about the population using information collected from the sample
What Do Statisticians Do?
- Gather data
- Summarize data
- Analyze data
- Draw conclusions and report the results of their analysis
0.1 - What is Statistics?
0.1 - What is Statistics?Statistics
The art and science of answering questions and exploring ideas through the processes of gathering data, describing data, and making generalizations about a population on the basis of a smaller sample.
Statistical literacy
“People’s ability to interpret and critically evaluate statistical information and data-based arguments appearing in diverse media channels, and their ability to discuss their opinions regarding such statistical information”
Statistical literacy is important because you are faced with statistics problems in your personal and professional lives.
Examples
Choosing a Medication
Your doctor gives you the option to choose one of two different medications. She provides you with research studies comparing the two medications. How can you use those research studies to inform your decision?
Fantasy Football
In planning for your fantasy football team you come across many tables of statistics. How can you synthesize all of those numbers to best inform your fantasy football draft?
School Curriculum
Your child's school is selecting a new science curriculum. The administration has narrowed it down to three different curricula and is asking parents to vote. What information would you ask for to inform your vote?
Driving to Work
There are two routes that you could take to get to work in the morning. If you go through town, it usually takes between 6 and 14 minutes, depending on the traffic and red lights. If you take the interstate, it consistently takes 10 minutes. Which route will you take to work this morning?
Marketing Decisions
Your company has put you in charge of making a decision between two marketing campaigns. How can you design a research study to collect data to inform your decision?
0.2 - Foundations
0.2 - FoundationsPopulations and Parameters
- Population
- any large collection of objects or individuals, such as Americans, students, or trees about which information is desired
- Parameter
- any summary number, like an average or percentage, that describes the entire population
The population mean $\mu$ (the Greek letter "mu") and the population proportion $p$ are two different population parameters. For example:
- We might be interested in learning about the average weight of all middle-aged female Americans. The population consists of all middle-aged female Americans, and the parameter is $\mu$.
- Or, we might be interested in learning about the proportion of likely American voters approving of the president's job performance. The population comprises all likely American voters, and the parameter is $p$.
The problem is that almost all of the time, we don't — or can't — know the real value of a population parameter. The best we can do is estimate the parameter! This is where samples and statistics come in to play.
Samples and Statistics
- Sample
- is a representative group drawn from the population
- Statistic
- any summary number, like an average or percentage, that describes the sample
The sample mean, $\bar{X}$, and the sample proportion, $\hat{p}$, are two different sample statistics. For example:
- We might use $\bar{x}$, the average weight of a random sample of 100 middle-aged female Americans, to estimate $\mu$, the average weight of all middle-aged female Americans.
- Or, we might use $\hat{p}$, the proportion in a random sample of 1000 likely American voters who approve of the president's job performance, to estimate $p$, the proportion of all likely American voters who approve of the president's job performance.
Because samples are manageable in size, we can determine the actual value of any statistic. We use the known value of the sample statistic to learn about the unknown value of the population parameter.
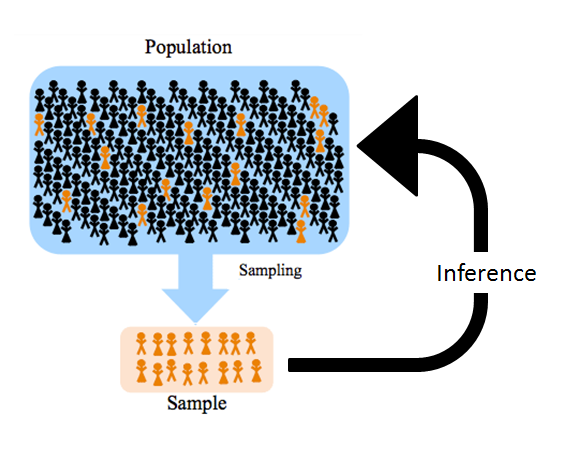
Techniques of describing data in ways to capture the essence of the information in the data are called descriptive statistics. For example, the sample mean is a descriptive statistic. To draw conclusions from data about the population is called inferential statistics. Here is a picture that demonstrates inferential statistics.
0.3 - Introduction to Minitab
0.3 - Introduction to MinitabMinitab®
A Quick Introduction to Minitab Statistical Software
This introduction to Minitab is intended to provide you with enough information to get you started using the basic functionality of Minitab. Of course, you will learn more about Minitab and its capabilities as you proceed through the course you are taking.
Obtaining a Copy of Minitab
Penn State users have access to the Minitab Web App, the cloud-based version of the software. All faculty and students who use Minitab software for coursework will need to order the Minitab Web App. See: How do I access the Minitab Web App.
Opening files in Minitab Web App
To open Minitab project files (.mpx) or data files in the Minitab Web App go to 'Upload Local Files' and find your Minitab project file.
You can also search for files in your PSU OneDrive account, Google Drive, or from a local folder on your computer.
Analyzing Data
The Minitab Help and How-To documentation provides step-by-step instructions on using Minitab to analyze data. The individual course notes will also provide details for each specific use of Minitab within that course.
Copying Minitab Output and Graphs into Word
To copy output appearing in the Session window, select the desired output using your mouse. To copy a graph window, make the graph window active by clicking anywhere in it, and the select Edit > Copy Graph.
To paste either output or a graph, select Edit > Paste (or use the standard clipboard icon used to denote pasting).
Saving Your Work
While you can save your work in bits and pieces — the graphs separately from the worksheet —more often than not, it is best to save your entire Minitab "project." A Minitab project includes all of the work created in one session, including multiple worksheets, the Session window, and multiple graph windows. Basically, if you save your work as a Minitab project, you can resume your work right where you left off.
To save your work as a Minitab project, select File > Save Project As..., and provide an appropriate filename in the dialog box. Minitab projects are given a ".MPX" extension. For the purpose of this course, you may consider creating one project for each lesson, and thereby naming the projects lesson1.MPX, lesson2.MPX, and so on.
Minitab Help
There are various ways that you can get Minitab help.
- You can look for help in the Minitab Help on-line manual also listed in the pull-down menu.
- You can use the various sets of Minitab instructions provided to you throughout the course. You will probably find links to these from the Homework Problems and Lab Activities in each lesson.
- Finally, you can post a question to a discussion in Canvas. Other students or your instructor can provide ideas and feedback.
Support From Minitab
Minitab offers several resources that are helpful for you. Minitab 20 Support - Getting Started is a concise guide designed to quickly get you familiar with using Minitab Statistical Software.
Help
A complete Help file is incorporated in Minitab, which provides you with instructions, examples with interpretations, overviews and detailed explanations, troubleshooting tips, formulas, references, and a glossary. Open Help by choosing Help > Help or by clicking on the Help button on every dialog box in the software.
Tutorials
Step-by-step tutorials help new users learn how to use Minitab. You can open these by choosing Help > Tutorials while using Minitab.
Last, but not least, remember that Minitab provides a support team staffed by professionals with expertise in the software, statistics, quality improvement, and computer systems. Visit the Minitab support web site or call +1-814-231-2682 to speak with Minitab's technical support specialists.