1.5.2 - Measures of Position
1.5.2 - Measures of PositionWhile measures of central tendency are important, they do not tell the whole story. For example, suppose the mean score on a statistics exam is 80%. From this information, can we determine a range in which most people scored? The answer is no. There are two other types of measures, measures of position and variability, that help paint a more concise picture of what is going on in the data. In this section, we will consider the measures of position and discuss measures of variability in the next one.
Measures of position give a range where a certain percentage of the data fall. The measures we consider here are percentiles and quartiles.
- Percentiles
- The pth percentile of the data set is a measurement such that after the data are ordered from smallest to largest, at most, p% of the data are at or below this value and at most, (100 - p)% at or above it.
A common application of percentiles is their use in determining passing or failure cutoffs for standardized exams such as the GRE. If you have a 95th percentile score then you are at or above 95% of all test takers.
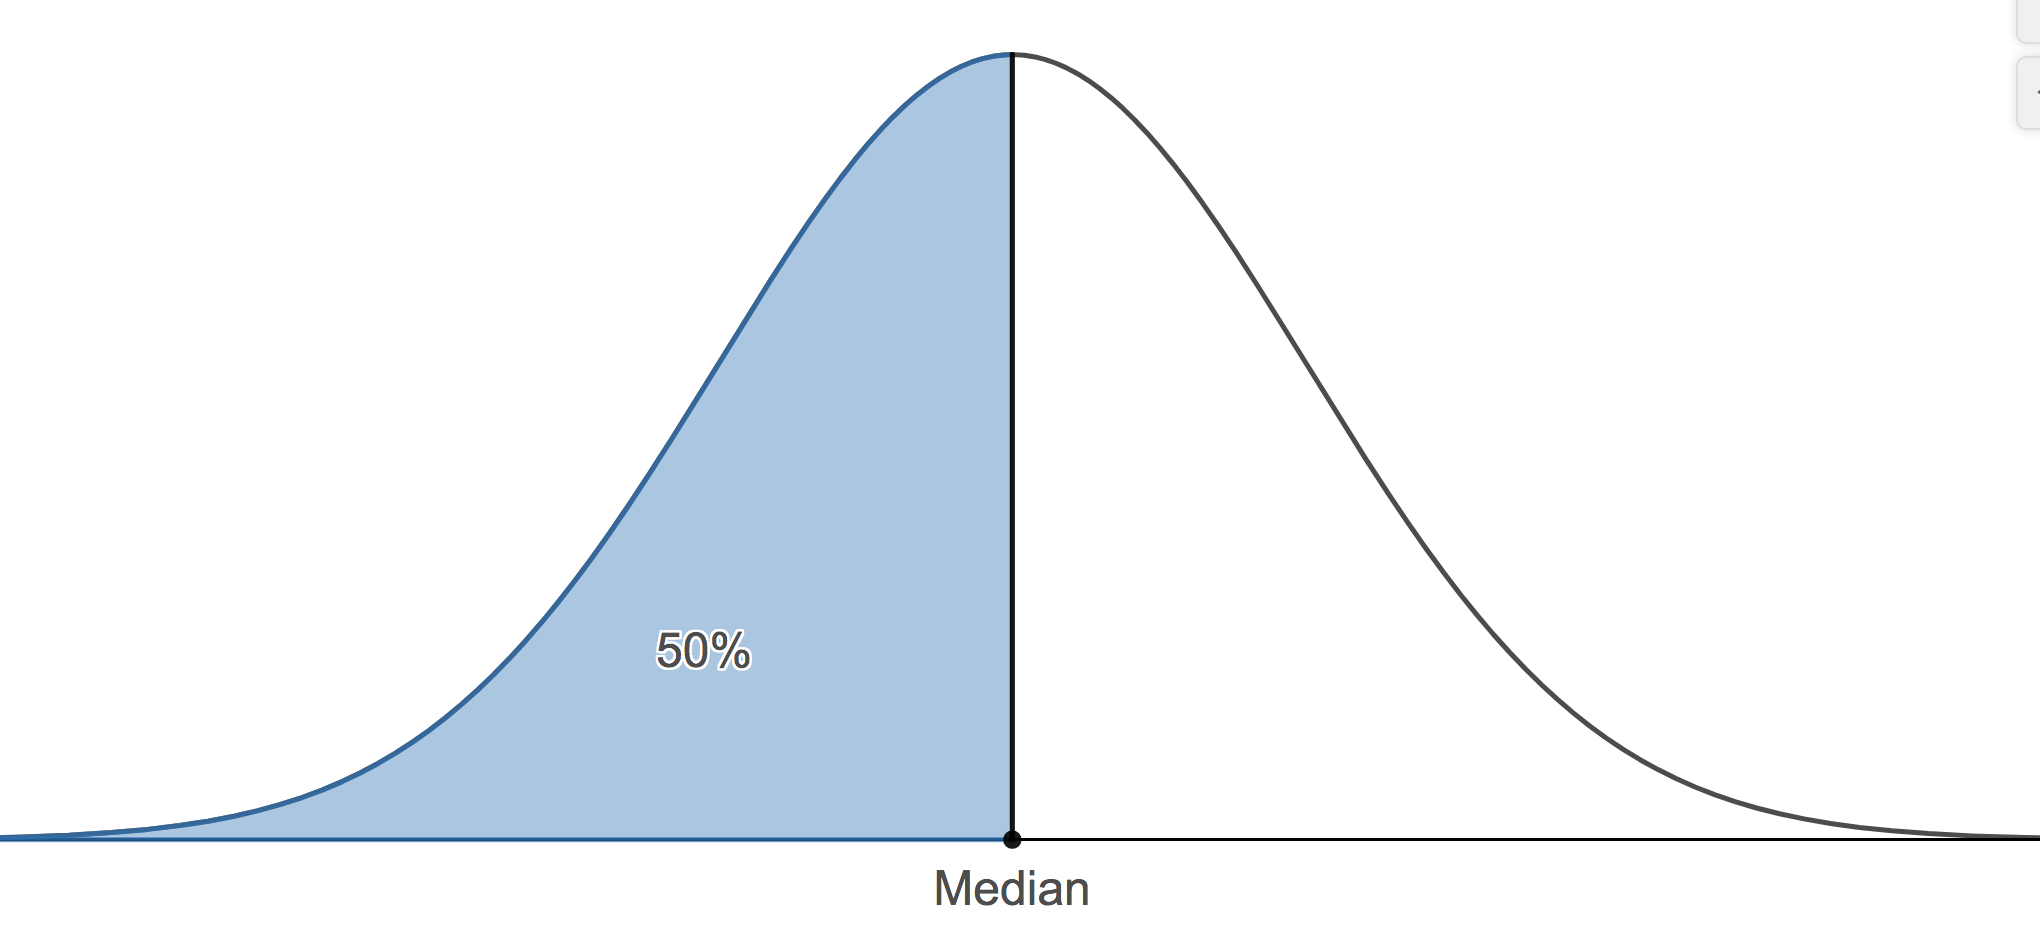
The median is the value where fifty percent or the data values fall at or below it. Therefore, the median is the 50th percentile.
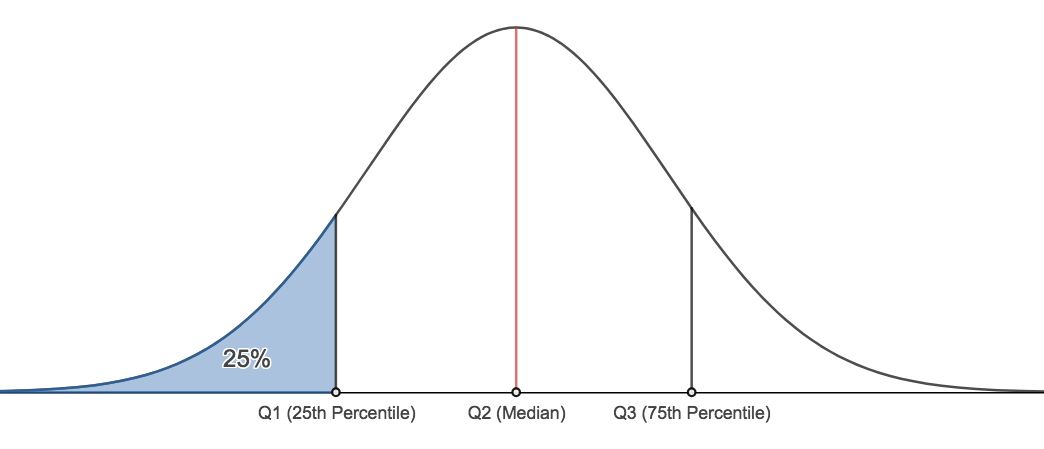
- We can find any percentile we wish. There are two other important percentiles. The 25th percentile, typically denoted, Q1, and the 75th percentile, typically denoted as Q3. Q1 is commonly called the lower quartile and Q3 is commonly called the upper quartile.
Finding Quartiles
The method we will demonstrate for calculating Q1 and Q3 may differ from the method described in our textbook. The results shown here will always be the same as Minitab's results. The method here is also different from the method presented in many undergraduate statistics courses. This method is what we require students to use.
There are two steps to follow:
- Find the location of the desired quartile
If there are n observations, arranged in increasing order, then the first quartile is at position $\dfrac{n+1}{4}$, second quartile (i.e. the median) is at position $\dfrac{2(n+1)}{4}$, and the third quartile is at position $\dfrac{3(n+1)}{4}$.
- Find the value in that position for the ordered data.
Example 1-7: Final Exam Scores
The final exam scores of 18 students are (in increasing order):
24, 58, 61, 67, 71, 73, 76, 79, 82, 83, 85, 87, 88, 88, 92, 93, 94, 97
Find the lower quartile (Q1), the median, and the upper quartile (Q3).
In this example, $n=18$.
For Q1, its position is: $\dfrac{18+1}{4}=4.75$
The actual value of Q1: Q1 = 67 (4th position) + 0.75 · (71 - 67) = 70
For the median, its position is: $\dfrac{18+1}{2}=9.5$
The actual value of the median: Q2 = 82 (9th position) + 0.5 · (83 - 82) = 82.5
For Q3, its position is: \(\dfrac{3(18+1)}{4}=14.25\)
The actual value of Q3: Q3 = 88 + 0.25 · (92 - 88) = 89
The 5 - Number Summary
The Five-Number Summary:
A helpful summary of the data is called the five number summary. The five number summary consists of five values:
- The minimum
- The lower quartile, Q1
- The median (also known as Q2)
- The upper quartile, Q3
- The maximum
Example 1-7
Find the five number summary for the final exam scores. Interpret the values.
\(Min=24, Q1=70, Median=82.5, Q3=89, Max=97\)
The lowest score on the final exam was 24. The highest score on the exam was 97. 25% of the students scored a 70 or below. 50% of the students scored above an 82.5. 75% of the students scored 89 or below. We can also say that 25% of the students scored at least an 89.