1.5.4 - Minitab: Descriptive Statistics
1.5.4 - Minitab: Descriptive StatisticsMinitab®
Descriptive Statistics
Let's perform some basic operations in Minitab. Some of the examples below are repeats of what we did by hand in earlier lessons while others are new. First, we saw previously how you can enter data into the Minitab worksheet by hand, we will now walk through how to load a dataset into Minitab from an Excel file.
Loading Data into Minitab from an Excel File
For the examples in this section, download the minitabintrodata.xlsx spreadsheet file. Save the file locally (if using Minitab installed on the computer you are using).
Open Minitab web and choose 'Open Local File' to find the spreadsheet file.
With the data in the Minitab worksheet, you can then perform any number of procedures. First, we obtain some basic descriptive statistics.
Descriptive Statistics
With the data from the Excel spreadsheet file into your Minitab worksheet window, you should notice that all columns are labeled ‘Cx’ where the ‘x’ is a number. Some of these are followed by a ‘-T’. Those columns with the ‘-T’ indicate that the data in this column are considered text or categorical data. Otherwise, Minitab recognizes the data as quantitative. If the operation you conduct in Minitab only functions on a certain variable type (e.g. calculating the mean can only be done on quantitative data) then only columns of that data type will be available to use for those operations.
Minitab®
Example 1-10 Hours Data
Let's use Minitab to calculate the five number summary, mean and standard deviation for the Hours data, (contained in minitabintrodata.xlsx). And, as you will see, Minitab by default will provide some added information.
1. At top of the Minitab window select the menu option Stat > Basic Statistics > Display Descriptive Statistics
2. Once this dialog box opens your cursor should be blinking in the 'Variables' window. If not, simply click inside this part of the dialog box. The only variables you should see in the left side window are columns of quantitative data (the two price columns, age, and hours). To enter a variable from the left hand window into the Variables window you can either double-click that variable or click the variable to highlight it and then click the 'Select' button. Do so with the variable 'Hours'.
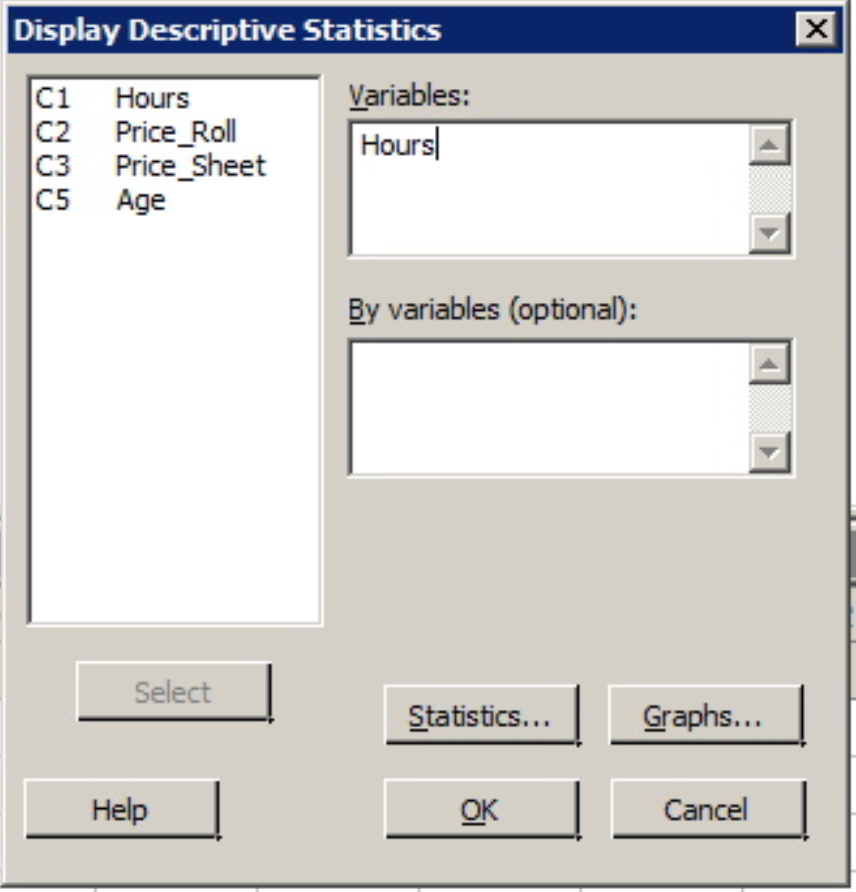
3. With the variable 'Hours' in the 'Variable' window click the 'OK' button.
The following output should appear in the Session window above the worksheet.
Statistics
Variable | N | N* | Mean | SE Mean | StDev | Minimum | Q1 | Median | Q3 | Maximum |
|---|---|---|---|---|---|---|---|---|---|---|
Hours | 50 | 835 | 16.00 | 1.19 | 8.45 | 4.00 | 9.00 | 15.00 | 22.25 | 34.00 |
The mean, standard deviation (StDev), etc. should be the same values as those calculated in the practice problems. Minitab also gives the size of the sample used to create these statistics (N), and the number of observations from this data that were missing (N*).
These statistics are the default statistics. Additional basic descriptive statistics are also available such as trim mean and coefficient of variation (CV).
Minitab®
Example 1-11: The Coefficient of Variation (CV)
To get the CV values for the Price per Sheet and Price per Roll an example found in an earlier lesson, (data contained in minitabintrodata.xlsx).
- Open Minitab and return to Stat > Basic Statistics > Display Descriptive Statistics.
- Enter both variables into the Variables window. That is, both 'Price_Roll' and 'Price_Sheet' should be in the Variables window.
- Click the Statistics tab and then check the box for 'Coefficient of Variation' (notice the other statistics available!) and click OK.
- Click OK again.
The output will include the same statistics as the example above plus the CV values, (it will be titled 'CoefVar').
Descriptive Statistics: Price_Roll, Price_Sheet
Statistics
Variable | N | N* | Mean | SE Mean | StDev | CoefVar | Minimum | Q1 | Median | Q3 | Maximum |
|---|---|---|---|---|---|---|---|---|---|---|---|
Price_Roll | 24 | 861 | 0.9196 | 0.0864 | 0.4233 | 46.03 | 0.5300 | 0.6075 | 0.7750 | 0.9500 | 1.9800 |
Price_Sheet | 24 | 861 | 0.01134 | 0.00113 | 0.00553 | 48.78 | 0.00610 | 0.00753 | 0.00995 | 0.01490 | 0.03180 |