Find a Confidence Interval and a Prediction Interval for the Response
Find a Confidence Interval and a Prediction Interval for the ResponseMinitab® – Procedure
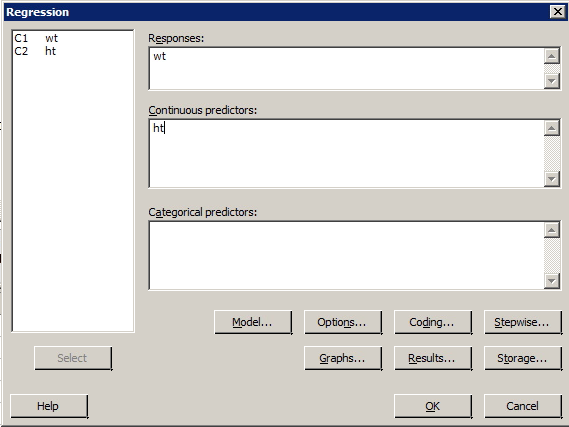
- Select Stat >> Regression >> Regression >> Fit Regression Model ...
- Specify the response and the predictor(s).
- Select OK. The output will appear in the session window.
Next, back up to the Main Menu having just run this regression:
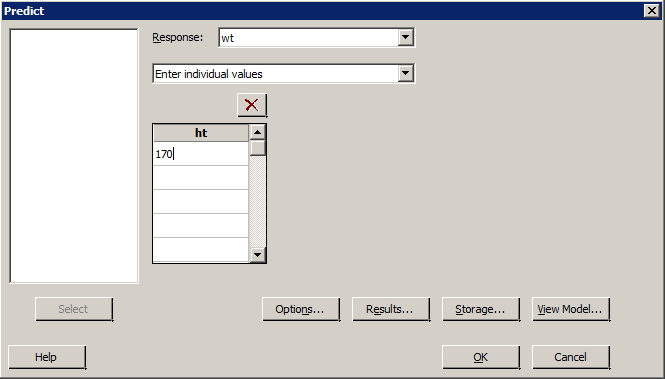
- Select Stat >> Regression >> Regression >> Predict ...
- Specify the response.
- Specify either the x value ("Enter individual values") or a column name ("Enter columns of values") containing multiple x values.
- Select Options... Specify the Confidence level — the default is 95%. Select OK.
- Select OK. The output will appear in the session window.
Example
For people of the same age and gender, height is often considered a good predictor of weight. The data set htwtmales.txt contains the heights (ht, in cm) and weights (wt, in kg) of a sample of 14 males between the ages of 19 and 26 years.
- Find a 95% prediction interval for the weight of a randomly selected male, aged 19 to 26, who is 170 centimeters tall.
- Find a 95% confidence interval for the average weight of all males, aged 19 to 26, who are 170 centimeters tall.
Minitab Dialog Boxes
Resulting Sample Minitab Output
Prediction for wt
Regression Equation
wt = -60.6 + 0.755 ht
| Variable | Setting | no heading | no heading | ||
|---|---|---|---|---|---|
| ht | 170 | ||||
| Fit | SE Fit | 95% CI | 95%PI | ||
| 67.6694 | 2.83819 | (61.4855, 73.8533) | (47.0975, 88.2413) | ||