8.5 - Additive Effects
8.5 - Additive EffectsExample 8-3: Birth Weight and Smoking
Earlier in this lesson, we investigated a set of data in which the researchers (Daniel, 1999) were interested in determining whether a baby's birth weight was related to his or her mother's smoking habits during pregnancy. The researchers collected the following data (Birth Smoker data) on a random sample of n = 32 births:
- Response \(\left( y \right) \colon\) birth weight in grams of baby
- Potential predictor \(\left( x_1 \right) \colon\) length of gestation in weeks
- Potential predictor \(\left( x_2 \right) \colon\) smoking status of mother (yes or no)
For these data, we formulated the following first-order model:
\(y_i=\beta_0+\beta_1x_{i1}+\beta_2x_{i2}+\epsilon_i\)
where:
- \(y_{i}\) is the birth weight of baby i in grams
- \(x_{i1}\) is the length of gestation of baby i in weeks
- \(x_{i2} = 1\), if baby i's mother smoked and \(x_{i2} = 0\), if not
and the independent error terms \(\epsilon_i\) follow a normal distribution with mean 0 and equal variance \(\sigma^{2}\).
Do you think the two predictors — the length of gestation and the smoking behavior of the mother — interact? That is, do you think the effect of the gestation length on mean birth weight depends on whether or not the mother is a smoker? Or, equivalently, do you think the effect of smoking on mean birth weight depends on the length of gestation?
We can take a look at the estimated regression equation to arrive at reasonable answers to these questions. Upon analyzing the sample of n = 32 births, Minitab reports that:
The regression equation is:
The regression equation is
Weight = -2390 + 143 Gest - 245 SmokingAnd, a plot of the estimated regression equation looks like this:
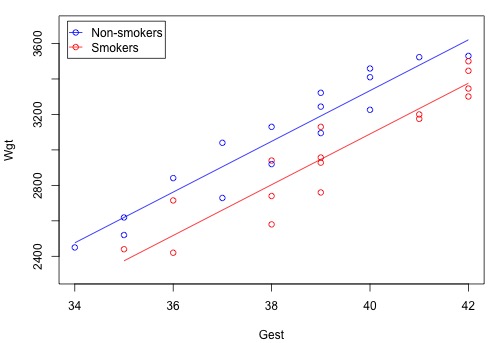
The blue circles and line represent the data and estimated function for non-smoking mothers \(\left(x_2 = 0 \right)\), while the red circles and line represent the data and estimated function for smoking mothers \(\left(x_2 = 1 \right)\). Remember that the two lines in this plot are exactly parallel.
Now, in light of the plot, let's investigate those questions again:
- Does the effect of the gestation length on mean birth weight depend on whether or not the mother is a smoker? The answer is no! Regardless of whether or not the mother is a smoker, for each additional week of gestation, the mean birth weight is predicted to increase by 143 grams. This lack of interaction between the two predictors is exhibited by the parallelness of the two lines.
- Does the effect of smoking on mean birth weight depend on the length of gestation? The answer is no! For a fixed length of gestation, the mean birth weight of babies born to smoking mothers is predicted to be 245 grams lower than the mean birth weight of babies born to non-smoking mothers. Again, this lack of interaction between the two predictors is exhibited by the parallelness of the two lines.
When two predictors do not interact, we say that each predictor has an "additive effect" on the response. More formally, a regression model contains additive effects if the response function can be written as a sum of functions of the predictor variables:
\(\mu_y=f_1(x_1)+f_2(x_2)+ ... + f_{p-1}(x_{p-1})\)
For example, our regression model for the birth weights of babies contains additive effects, because the response function can be written as a sum of functions of the predictor variables:
\(\mu_y=(\beta_0)+(\beta_1x_{i1})+(\beta_2x_{i2})\)