8: Randomization Design Part II
8: Randomization Design Part IIOverview
Split-Plot Designs
Sometimes multi-factor experiments use multiple (different) experimental units for the different factors in the experiment. To visualize this, think of applying multiple treatments in a sequence. The levels of the first factor are applied to experimental units using specific randomization and then the levels of a second factor are applied to sub-units within the application of the first factor. In other words, the experimental unit used for the application of the first factor has been split, forming the experimental units for the application of the second-factor levels.
Split-plot designs accommodate the above scheme in assigning two factors appropriately to their experimental units. They are extremely common and typically result from logistical restrictions, practicality, or efficiency. Though sometimes split-plots and their experimental unit set up are difficult to recognize, understanding the correct structure is necessary for the implementation of ANOVA.
Split-plots occur most commonly in two experimental designs applied for the first factor: the CRD and RCBD. The ANOVA differs between these two and this lesson focuses on both types. Split-plots can be extended to accommodate multiple splits by sub-unit subdivision. For example, a split-split-plot experimental design can be achieved with three stages of randomization for three treatments when there are three types of experimental units with two sub-divisions.
Objectives
- Recognize multiple experimental units in an experimental design.
- Understand the structure of split-plot ANOVA.
- Utilize split-plots administered in RCBD experiments.
- Utilize split-plots administered in CRD experiments.
- Extend the split-plot concept to analyze split-split-plot designs.
8.1 - Split-Plot in RCBD
8.1 - Split-Plot in RCBDRecall the Randomized Complete Block Design (RCBD) we discussed in lesson 7. In RCBD, general blocks are formed such that the experimental units are expected to be homogenous within a block and heterogeneous between blocks.
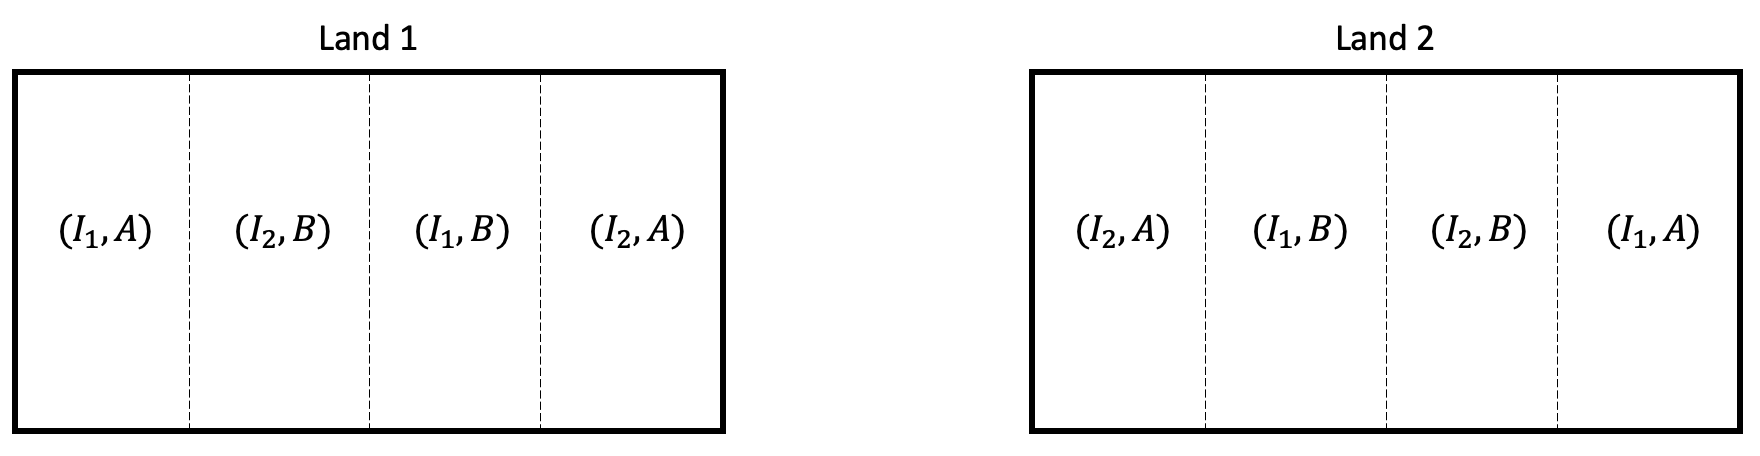
For example, suppose we are studying the effect of irrigation amount (\(I_1\) and \(I_2\)) and fertilizer type (\(A\) and \(B\)) on crop yield. We have 4 treatments in this experiment. Suppose we want to have at least 2 replicates and two large lands that can be used for the experiment. In RCBD, we can split each land into 4 fields and can apply the 4 treatments randomly to each field. Here lands are blocks and fields are the experimental units.
In this example, we have assumed that managing levels of irrigation and fertilizer require the same effort. Now suppose varying the level of irrigation is difficult on a small scale and it makes more sense to apply irrigation levels to larger areas of land.
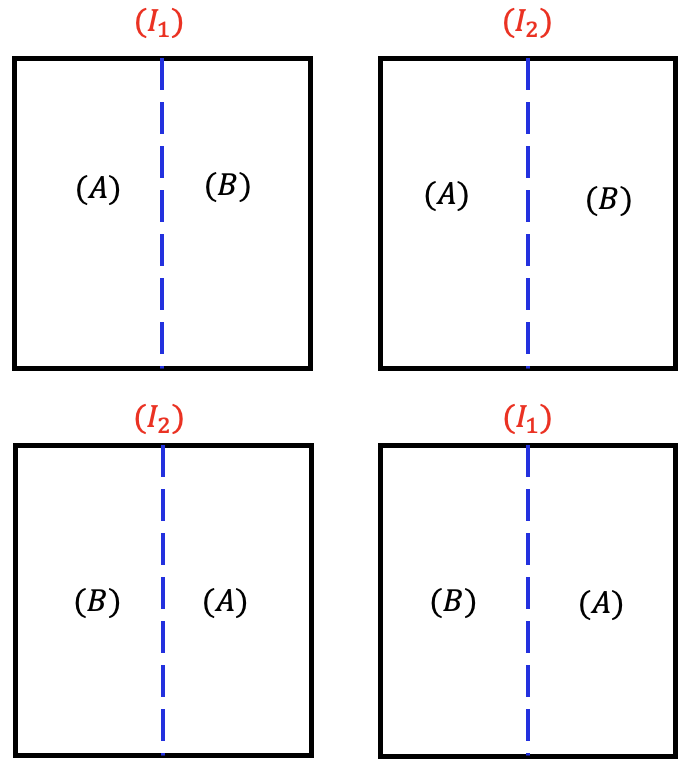
In such situations, we can divide each land into two large fields (whole plots) and apply irrigation amounts to each field randomly. And then divide each of these large fields into smaller fields (subplots) and apply fertilizer randomly within the whole plots.
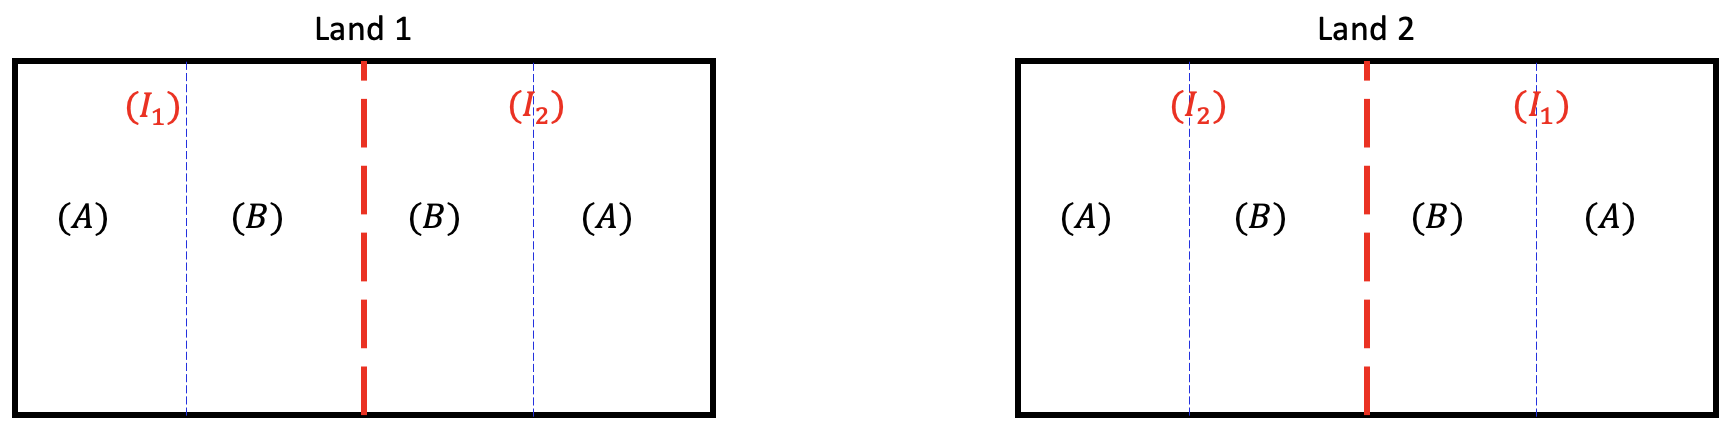
In this strategy, each land contains two whole plots and the irrigation amount is assigned to each whole plot randomly using RCBD (i.e. lands are treated as blocks, and the irrigation amount is assigned randomly within each block to the whole plots). Each whole plot contains two subplots and fertilizer type is assigned to each subplot using RCBD (i.e. whole plots are treated as blocks and fertilizer type is assigned randomly within each whole plot to the subplots).
When some factors are more difficult to vary than others at the level of experimental units, it is more efficient to assign the difficult-to-change factors to larger units (whole plots) and then apply the easier-to-change factor to smaller units (subplots). This is known as the split-plot design.
As an example, consider an experiment where fabric is dyed at 4 different temperatures for 3 different amounts of time. The differences in color saturation are of interest. If the experimenters desire 3 replications for each of the 12 temperature and time combinations (i.e. 12 treatments), a basic CRD or an RCBD (with a suitable blocking factor that would generate the replicates) will require as many as 36 attempts of testing.
Instead, the experiment can be modified as follows to reduce effort and time. Regarding dye tanks as blocks, the 3 tanks can be set to each of the 4 different temperature settings (sequentially and in random order). Then, for each tank and each temperature, the 3 fabrics are randomly selected to be taken out of the tank at the 3 different time intervals.
In this setting, temperatures are assigned randomly within each dye tank (i.e. tank is treated as a block), and within each temperature, the dying times are assigned randomly to the fabric. We have two RCBD sub-experiments: whole plot levels (temperatures) are assigned as RCBD within the tank and subplot levels (dying time) are assigned as RCBD within whole plot levels.
The data (Dye Time Data) were:
Tank Temperature | |||||
|---|---|---|---|---|---|
Rep | Dying Time (min) | 100 | 120 | 180 | 220 |
I | 20 | 15 | 32 | 56 | 58 |
40 | 33 | 47 | 62 | 65 | |
60 | 37 | 58 | 78 | 80 | |
II | 20 | 18 | 36 | 57 | 62 |
40 | 29 | 49 | 63 | 67 | |
60 | 32 | 55 | 75 | 79 | |
III | 20 | 16 | 33 | 54 | 57 |
40 | 27 | 43 | 67 | 63 | |
60 | 35 | 54 | 73 | 77 | |
It is important to notice that in a split-plot design, randomization is a two-stage process. Levels of one factor (say, factor A) are randomized over the whole plots within each block, and the levels of the other factor (say, factor B) are randomized over the subplots within each whole plot. This restriction in randomization results in two different error terms: one appropriate for comparisons at the whole plot level and one appropriate for comparisons at the subplot level.
The appropriate error for whole plot level in split-plot RCBD is \(\text{whole plot factor} \times \text{block}\) interaction. In other words, the analysis at the whole plot level is essentially a one-way ANOVA with blocking (i.e. one observation per block-treatment combination). From the perspective of the whole plot, the subplots are simply subsamples and it is reasonable to average them when testing the whole plot effects (i.e. factor A effects).
The subplot factor (i.e. factor B) is always compared within the whole plot factor.
Source | DF |
|---|---|
Blocks | \(r-1\) |
Factor \(A\) | \(a-1\) |
Blocks \(\times\) Factor \(A\) (Whole plot Error) | \((r-1)(a-1)\) |
Factor \(B\) | \(b-1\) |
\(A \times B\) | \((a-1)(b-1)\) |
Residual (Subplot Error) | a\((r-1)(b-1)\) |
Total | \(rab - 1\) |
The statistical model associated with the split-plot design with whole plots arranged as RCBD is
\(Y_{ijk} = \mu + \alpha_i + \gamma_k + (\alpha\gamma)_{ik} + \beta_j + (\alpha\beta)_{ij} + \epsilon_{ijk}\)
where \(\gamma_k\) for \(k=1,...,r\) are block effects, \(\alpha_i\) for \(i=1,...,a\) are factor A effects, and \(\beta_j\) for \(j=1,...,b\) are factor B effects.
Therefore, the ANOVA table for the example above would look like this:
Source | DF | Expected Mean Square | Error Term |
|---|---|---|---|
(Whole Plots) | |||
Blocks | 1 | Var(Residual) + 3Var(Blocks*A) + 12Var(Blocks) | MS(Blocks*A) |
A | 1 | Var(Residual) + 3Var(Blocks*A) + Q(A,A*B) | MS(Blocks*A) |
Blocks*A | 1 | Var(Residual) + 3Var(Blocks*A) | |
(Subplots) | |||
B | 1 | Var(Residual) + Q(B, A*B) | MS(Residual) |
A*B | 1 | Var(Residual) + Q(A*B) | MS(Residual) |
Residual | 2 | Var(Residual) |
Using Technology
In SAS, we could specify the model with the following statements:
proc mixed data=DyeTimeData method=type3;
                class tank temp time;
                model resp=temp time temp*time;
                random tank tank*temp;
                run;
This will generate the ANOVA table as below.
Type 3 Analysis of Variance | ||||||||
|---|---|---|---|---|---|---|---|---|
Source | DF | Sum of Squares | Mean Square | Expected Mean Square | Error Term | Error DF | F Value | Pr > F |
temp | 3 | 9762.333333 | 3254.111111 | Var(Residual) + 3 Var(tank*temp) + Q(temp,temp*time) | MS(tank*temp) | 6 | 984.44 | <.0001 |
time | 2 | 2380.166667 | 1190.083333 | Var(Residual) + Q(time,temp*time) | MS(Residual) | 16 | 232.21 | <.0001 |
temp*time | 6 | 84.500000 | 14.083333 | Var(Residual) + Q(temp*time) | MS(Residual) | 16 | 2.75 | 0.0496 |
tank | 2 | 28.166667 | 14.083333 | Var(Residual) + 3 Var(tank*temp) + 12 Var(tank) | MS(tank*temp) | 6 | 4.26 | 0.0705 |
tank*temp | 6 | 19.833333 | 3.305556 | Var(Residual) + 3 Var(tank*temp) | MS(Residual) | 16 | 0.64 | 0.6936 |
Residual | 16 | 82.000000 | 5.125000 | Var(Residual) | . | . | . | . |
The ANOVA table can be rearranged to the following to make it easier to understand the whole plot and subplot analyses.
Source | DF | Expected Mean Square |
|---|---|---|
(Whole Plots) | ||
tank | 2 | Var(Residual) + 3 Var(tank*temp) + 12 Var(tank) |
temp | 3 | Var(Residual) + 3 Var(tank*temp) + Q(temp, temp*time) |
tank*temp | 6 | Var(Residual) + 3 Var(tank*temp) |
(Subplots) | ||
time | 2 | Var(Residual) + Q(time, temp*time) |
temp*time | 6 | Var(Residual) + Q (temp*time) |
Residual | 16 | Var(Residual) |
Notice that the correct error term for the F-test of the treatment applied to whole plots is the \(\text{block} \times \text{whole plot factor}\) (assuming blocks are a random effect).
Note!
One might wonder about the terms \(\text{block} \times \text{subplot factor}\) and \(\text{block} \times \text{whole plot factor} \times \text{subplot factor}\). With these terms in the model, we would not be able to retrieve the residual (the error DF would be zero). If repeat observations are made within the split plots, then a separate error term can be estimated. However, it is important to keep in mind that tests of replication effects are not of interest, but are being isolated in the ANOVA to reduce the error variance. As a result, the model that is usually run in this design drops out the \(\text{block} \times \text{subplot factor}\) and \(\text{block} \times \text{whole plot factor} \times \text{subplot factor}\) terms, and combines these interactions with the true error variance to obtain a working error term.
First, load and attach the dye time data in R. Notice we change the numerical variables to factors.
setwd("~/path-to-folder/")
                baketime_data <- read.table("dyetime_data.txt",header=T)
                baketime_data$tank = factor(baketime_data$tank)
                baketime_data$temp = factor(baketime_data$temp)
                baketime_data$time = factor(baketime_data$time)
                attach(baketime_data)
The aov function can accommodate simple random effect models and works well for split plots. Here we use the Error function to specify random terms and display the ANOVA table using summary.
aov1 = aov(resp ~ temp + time + temp:time + Error(tank + tank:temp))
                summary(aov1)
Error: tank
Df Sum Sq Mean Sq F value Pr(>F)
Residuals 2 28.17 14.08
Error: tank:temp
Df Sum Sq Mean Sq F value Pr(>F)
temp 3 9762 3254 984.4 1.82e-08 ***
Residuals 6 20 3
---
Signif. codes: 0 ‘***’ 0.001 ‘**’ 0.01 ‘*’ 0.05 ‘.’ 0.1 ‘ ’ 1
Error: Within
Df Sum Sq Mean Sq F value Pr(>F)
time 2 2380.2 1190.1 232.211 1.51e-12 ***
temp:time 6 84.5 14.1 2.748 0.0496 *
Residuals 16 82.0 5.1
---
Signif. codes: 0 ‘***’ 0.001 ‘**’ 0.01 ‘*’ 0.05 ‘.’ 0.1 ‘ ’ 1 The output is broken down into the whole plot (under “Error: tank” and “Error: tank: temp”) and subplot (under “Error: Within”) terms. The residuals in each section correspond to the error used for those factors, e.g. under “Error: tank: temp” the “residuals” are the tank*temp interaction effect. Note the F-statistics for these residual terms are not included in the output, therefore they would need to be calculated by hand if they were of interest.
8.2 - Split-Plot in CRD
8.2 - Split-Plot in CRDRecall the irrigation amount and fertilizer type example we discussed in the previous section. We had two large lands and managing the irrigation amount was harder on a smaller scale, so we assigned the irrigation amount within each land to whole plots using an RCBD.
Now suppose in this case, instead of two large lands, we had 4 large fields. Irrigation amount is still a factor that is difficult to control. In that case, we can assign the irrigation amount randomly using a CRD for the 4 whole plots (fields). Then each whole plot can be divided into smaller fields (subplots) and we can assign fertilizer type randomly within each whole plot.
In split-plot designs, the subplots are always arranged in an RCBD within the whole plot. The difference between split-plot in RCBD and split-plot in CRD is how the whole plot factor is randomized.
Consider a study in which the experimenters are interested in two factors: irrigation (Factor A at 2 levels) and seed type (Factor B at 2 levels) and they are crossed to form a factorial treatment design. The seed treatment can be easily applied at a small scale, but the irrigation treatment is problematic. Irrigating one plot may influence neighboring plots, and furthermore, the irrigation equipment is most efficiently used in a large area. As a result, the investigators want to apply the irrigation to a large whole plot and then split the whole plot into 2 smaller subplots in which they can apply the seed treatment levels.
In the first step, the levels of the irrigation treatment are applied to four experimental (fields) to end up with 2 replications:
| Field 1 | Field 2 | Field 3 | Field 4 |
|---|---|---|---|
| A2 | A1 | A1 | A2 |
Following that, the fields are split into two subplots and a level of Factor B is randomly applied to subplots within each application of the Irrigation treatment:
| Field 1 | Field 2 | Field 3 | Field 4 |
|---|---|---|---|
| A2 B2 | A1 B1 | A1 B2 | A2 B1 |
| A2 B1 | A1 B2 | A1 B1 | A2 B2 |
In this design, the whole plot treatments (i.e. factor A, irrigation) are arranged in a CRD and the subplot treatments (i.e. factor B, seed type) are arranged within whole plots in an RCBD.
If we carefully think about this, we see that the replicates (i.e. fields) are nested within the whole factor levels. For example, fields 2 and 3 are nested within level \(A_1\), and fields 1 and 4 are nested within level \(A_2\). So the variability due to replicates is nested within the whole factor.
As discussed in section 8.1, from the perspective of whole plots, the subplots are simply subsamples and it is reasonable to average them when testing the whole plot effects (i.e. Factor A). If the values of the subplots within each whole plot are averaged, the resulting design is CRD. The error term in a simple CRD is \(\text{replication}(\text{whole factor})\). Therefore, for split-plot in CRD, the whole plot errors are computationally equivalent to \(\text{replication}(\text{whole factor})\), but in order to use it, we must explicitly extract it from the error term and put it in the model.
Again, the subplot factor (i.e. factor B) is always compared within the whole plot factor.
| Source | DF |
|---|---|
| Factor \(A\) | \(a-1\) |
|
Replicate(Factor \(A\)) (Whole plot Error) |
\(a(r-1)\) |
| Factor \(B\) | \(b-1\) |
| \(A \times B\) | \((a-1)(b-1)\) |
| Residual (Subplot Error) | a\((r-1)(b-1)\) |
| Total | \(rab - 1\) |
The statistical model for the design is:
\(Y_{ijk} = \mu + \alpha_i + \gamma_{k(i)} + \beta_j + (\alpha\beta)_{ij} + \epsilon_{ijk}\)
where \(i=1, 2, \dots, a\), \(j=1, 2, \dots, b\) and \(k=1,2,\dots, r\), where \(a\) is the number of levels in factor A, \(b\) is the number of levels in factor B and \(r\) is the number of replicates within each level of factor A (e.g. \(r=2\) in the example above).
Therefore, the ANOVA table for the example above would look like this:
| Source | DF | Expected Mean Square | Error Term |
|---|---|---|---|
| (Whole Plots) | |||
| A | 1 | Var(Residual) + 2Var(Replicate(A)) + Q(A, A*B) | MS(Replicate(A)) |
| Replicate(A) | 2 | Var(Residual) + 2Var(Replicate(A)) | |
| (Subplots) | |||
| B | 1 | Var(Residual) + Q(B, A*B) | MS(Residual) |
| A*B | 1 | Var(Residual) + Q(A*B) | MS(Residual) |
| Residual | 2 | Var(Residual) |
Using Technology
In SAS, the code would be:
proc mixed data=example_8_2 method=type3;
class factorA factorB field;
model resp=factorA factorB factorA*factorB;
random field(factorA);
run;
In Minitab the ‘field(FactorA)’ term would need to be constructed in the Random/Nest… options box under the STAT > ANOVA > General Linear Model > Fit the General Linear Model.
The aov function can be used for a split-plot in CRD. For this theoretical example, we use the Error function to specify the replicate (field) term nested within the whole plot factor (A) and display the ANOVA table using summary.
aov1 = aov(resp ~ factorA + factorB + factorA:factorB + Error(factorA/field))
summary(aov1)
8.3 - Split-Split-Plot Design
8.3 - Split-Split-Plot DesignThe idea of split-plots can easily be extended to multiple splits. In a 3-factor factorial, for example, it is possible to assign Factor A to whole plots, then Factor B to subplots within the applications of Factor A, and then split the experimental units used for Factor B into sub-subplots to receive the levels of Factor C.
For a fixed effect factorial treatment design in an RCBD (with blocks for the levels of Factor A, levels of Factor B, and levels of Factor C), the split-split-plot would produce the following table. (Hover over the error rows to see where the source or df comes from):
| Source | d.f. |
|---|---|
| (Whole plots) | |
| Block | r - 1 |
| Factor A | a - 1 |
| Whole plot error |
(r - 1)(a - 1) |
| (Subplots) | |
| Factor B | b - 1 |
| A × B | (a - 1)(b - 1) |
| Subplot error | a(r - 1)(b - 1) |
| (Sub-subplots) | |
| Factor C | c - 1 |
| A × C | (a - 1)(c - 1) |
| B × C | (b - 1)(c - 1) |
| A × B × C | (a - 1)(b - 1)(c - 1) |
| Sub-subplot error | ab(r - 1)(c - 1) |
| Total | (rabc) - 1 |
The model is specified as we did earlier for the split-plot in RCBD, retaining only the interactions involving replication where they form denominators for F-tests for factor effects. For the model above, we would need to include the block, block × A, and block × A × B terms in the random statement in SAS. In SAS, Block × A × B would automatically include the Block × B effect SS and df. All other interactions involving replications and factor C would be included in the residual error term. The block × A term is often referred to as ‘Error A’ (‘Whole plot error’ in the table), the Block × A × B term as ‘Error B’ (‘Subplot error’ in the table), and the residual error as ‘Error C’ (‘Sub-subplot error’ in the table) because of their roles as the denominator in the F-tests.
8.4 - Try it!
8.4 - Try it!Exercise 1
Researchers are investigating the effect of storage temperature on bacterial growth for two types of seafood. They set up the experiment to evaluate 3 storage temperatures. There were 9 storage units that were available, and so they randomly selected 3 storage units to be used for each storage temperature, and both seafood types were stored in each unit. After 2 weeks, bacterial counts were made. After taking a logarithmic transformation of the counts, they produced the following ANOVA:
| Type 3 Analysis of Variance | ||||
|---|---|---|---|---|
| Source | DF | Sum of Squares | Mean Square | Expected Mean Square |
| temp | 2 | 107.656588 | 53.828294 | Var(Residual) + 2 Var(unit(temp)) + Q(temp, temp*seafood) |
| seafood | 1 | 3.713721 | 3.713721 | Var(Residual) + Q(seafood, temp*seafood) |
| temp*seafood | 2 | 2.647594 | 1.323797 | Var(Residual) + Q(temp*seafood) |
| unit(temp) | 6 | 44.050650 | 7.341775 | Var(Residual) + 2 Var(unit(temp)) |
| Residual | 6 | 5.590873 | 0.931812 | Var(Residual) |
- For each factor, indicate whether it is a fixed or random effect.
- Identify the treatments and describe (in words) the treatment design.
- Describe the randomization used.
- Compute the F-statistic for the temperature effect in the ANOVA, and determine significance for the effect.
- Temp is fixed, seafood is fixed, and storage unit is random.
- Temperature and seafood. The treatment design is a factorial design. Each seafood type is combined with each temperature level in the experiment.
- Split-plot in a CRD. Temperature levels were assigned (randomly) to storage units. Then the storage unit set at a given temperature is split to accommodate each of the two seafood types.
- Temperature F=53.83/7.342=7.3318 \(F_{critical}=5.14\), Reject \(H_0\).
Exercise 2
Answer the questions based on the following output:
| Type 3 Analysis of Variance | ||||
|---|---|---|---|---|
| Source | DF | Sum of Squares | Mean Square | Expected Mean Square |
| group | 3 | 6429.388333 | 2143.129444 | Var(Residual) + 3 Var(blk*group) + Q(group,group*tech_int) |
| tech_int | 2 | 881.408750 | 440.704375 | Var(Residual) + Q(tech_int,group*tech_int) |
| group*tech_int | 6 | 207.507917 | 34.584653 | Var(Residual) + Q(group*tech_int) |
| blk | 3 | 408.985000 | 136.328333 | Var(Residual) + 3 Var(blk*group) + 12 Var(blk) |
| blk*group | 9 | 466.543333 | 51.838148 | Var(Residual) + 3 Var(blk*group) |
| Residual | 24 | 595.696667 | 24.820694 | Var(Residual) |
- For each factor, indicate whether it is a fixed or random effect.
- Identify the treatments and describe (in words) the treatment design.
- Describe (in words) the randomization used.
- Compute the F-statistic for each effect in the ANOVA, and determine significance (i.e., compare \(F_{calculated}\) to \(F_{critical}\) for each effect).
- Group is fixed, tech_int is fixed, and blk is random.
- Group and tech_int. They are crossed for a factorial treatment design.
- Split-plot in a RCBD, with group as the whole plot treatment and tech_int as the subplot treatment with blk as the blocking factor.
-
- group: \(F=\dfrac{2143.129444}{51.838148} =41.3427\), \(F_{critical} = 3.86\), Reject \(H_0\).
- tech_int: \(F= \dfrac{440.704375}{24.820694} = 17.7555\), \(F_{critical} = 3.40\), Reject \(H_0\).
- group x tech_int: \(F= \dfrac{34.584653}{24.820694} = 1.3934\), \(F_{critical} = 2.51\), Do not reject \(H_0\).
- blk: \(F = \dfrac{136.3283}{51.8381} = 2.6299\), \(F_{critical}= 3.86\), Do Not Reject \(H_0\).
Exercise 3
-
An experimenter wants to compare the yield of three varieties of oats at four different levels of manure. Suppose 6 farmers agree to participate in the experiment and each farmer will designate 3 fields from their farms for the experiment.
- What is the treatment design?
- What is the randomization design?
- Treatment design: 3X4 factorial with oat variety and manure levels as factors having 3 and 4 levels respectively.
- Randomization design: Three oats varieties will be randomly assigned to the 3 fields from each farm using RCBD with farms as blocks. Four manure levels are then randomized within each field using an RCBD. So the randomization design is a split-plot in RCBD.
- In an agricultural setting, an experimenter is applying one of two irrigation methods randomly to 6 plots where all plots are similar in moisture, soil type, slope, fertility, etc. Each plot is then subdivided into 5 portions and 5 levels of nitrogen fertilizer are applied randomly to these portions.
- What is the treatment design?
- What is the randomization design?
- Treatment design: 2X5 factorial with irrigation method and fertilizer levels as factors having 2 and 5 levels, respectively.
- Randomization design: Split-plot in CRD with the whole factor as irrigation method and subplot factor as fertilizer level.
- A survey was conducted to study whether the financial aid package amounts at a certain university differ between male and female athletes. The university offers 3 different types of aid packages: tuition reduction for 4 years, tuition reduction for the first year, or partial coverage of room and board. Within each package type, the package amount for a randomly selected male and female athlete was recorded.
- What is the treatment design?
- What is the randomization design?
- Treatment design: A single factor study with 2 levels - the factor of interest is gender.
- Randomization design: RCBD with package type as the blocking factor.
8.5 - Lesson 8 Summary
8.5 - Lesson 8 SummaryIn this lesson, we discussed split-plot designs with the special feature of having two types of experimental units: whole plots into which the whole plot treatments are assigned and the subplots into which the subplot treatments are assigned.
The whole plot assignment can be either according to a CRD or an RCBD, and depending on this design type, the overall design is either called a split-plot in CRD or RCBD. Note that in either case, the denominator of the F-statistic for testing the whole plot factor is not the MSE, but equals the MS of \(\text{replicate}(\text{A})\) and MS of \(\text{block} \times \text{A}\), respectively.