4.8 - Special Cases: p = 2
4.8 - Special Cases: p = 2To further understand the shape of the multivariate normal distribution, let's return to the special case where we have p = 2 variables.
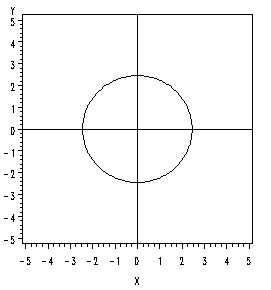
If \(ρ = 0\), there is zero correlation, and the eigenvalues turn out to be equal to the variances of the two variables. So, for example, the first eigenvalue would be equal to \(\sigma^2_1\) and the second eigenvalue would be equal to \(\sigma^2_2\) as shown below:
\(\lambda_1 = \sigma^2_1\) and \(\lambda_2 = \sigma^2_2\)
the corresponding eigenvectors will have elements 1 and 0 for the first eigenvalue and 0 and 1 for the second eigenvalue.
\(\mathbf{e}_1 = \left(\begin{array}{c} 1\\ 0\end{array}\right)\), \(\mathbf{e}_2 = \left(\begin{array}{c} 0\\ 1\end{array}\right)\)
So, the axis of the ellipse, in this case, is parallel to the coordinate axis.
If there is zero correlation, and the variances are equal so that \(\sigma^2_1\) = \(\sigma^2_2\), then the eigenvalues will be equal to one another, and instead of an ellipse we will get a circle. In this special case, we have a so-called circular normal distribution.
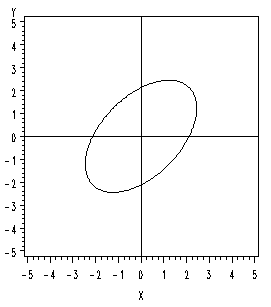
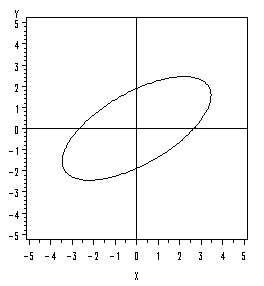
If the correlation is greater than zero, then the longer axis of the ellipse will have a positive slope.
Conversely, if the correlation is less than zero, then the longer axis of the ellipse will have a negative slope.
As the correlation approaches plus or minus 1, the larger eigenvalue will approach the sum of the two variances, and the smaller eigenvalue will approach zero:
\(\lambda_1 \rightarrow \sigma^2_1 +\sigma^2_2\) and \(\lambda_2 \rightarrow 0\)
So, what is going to happen in this case is that the ellipse becomes more and more elongated as the correlation approaches one.
Using Technology
The SAS program below can be used to plot the 95% confidence ellipse corresponding to any specified variance-covariance matrix.
Download the SAS program here: ellplot.sas
Note: In the upper right-hand corner of the code block you will have the option of copying ( ) the code to your clipboard or downloading ( ) the file to your computer.
options ls=78;
title "95% prediction ellipse";

data a;   /*This data set defines the polar coordinates for plotting the prediction ellipse as a function of the angle theta. It stores the results in variables 'u' and 'v' that will be used below.*/
  pi=2.d0*arsin(1);
  do i=0 to 200;
    theta=pi*i/100;
    u=cos(theta);
    v=sin(theta);
    output;
  end;
  run;

proc iml;   /*The iml procedure allows for many general calculations to be made. In this case*/
  create b var{x y};   /*This defines a data set 'b' with two variables 'x' and 'y' that will be used in the calculations below.*/
  start ellipse;   /*This defines a SAS module named 'ellipse' that can be called to calculate the xy coordinates for ploting the prediction ellipse. The lines of code below are executed when 'ellipse' is called.*/
    mu={0,   /*This specifies the value of the bivariate mean vector (0, 0). This will be the center of the prediction ellipse.*/
        0};
    sigma={1.0000 0.5000,   /*This specifies the values of the covariance matrix, which must be symmetric.*/
           0.5000 2.0000};
    lambda=eigval(sigma);   /*The statements below calculate the xy coordinates for plotting the ellipse from the polar coordinates that are provided above.*/
    e=eigvec(sigma);
    d=diag(sqrt(lambda));
    z=z*d*e`*sqrt(5.99);
    do i=1 to nrow(z);
      x=z[i,1];
      y=z[i,2];
      append;
    end;
  finish;   /*This ends the module definition.*/
  use a;   /*This makes the polar coordinates defined in the data set 'a' available.*/
  read all var{u v} into z;   /*The polar coordinates are assigned to the vector z, which is used in the ellipse module.*/
  run ellipse;   /*This calls the ellipse module, which runs and populates the data set 'b' with the xy coordinates that will be used for plotting the prediction ellipse.*/

proc gplot;   /*This plots the prediction ellipse from the coordinates in the data set 'b'.*/
  axis1 order=-5 to 5 length=3 in;   /*The axis statements set the limits of the plotting region.*/
  axis2 order=-5 to 5 length=3 in;
  plot y*x / vaxis=axis1 haxis=axis2 vref=0 href=0;   /*These options specify the variables for plotting, which to put on which axis, and the vertical and horizontal reference lines.*/
  symbol v=none l=1 i=join color=black;   /*This option specifies that the points are to be joined in a continuous curve in black.*/
  run;
The bivariate confidence interval for this example cannot be generated using Minitab.