S.1 Basic Terminology
S.1 Basic TerminologyPopulation and Parameters
- Population
- A population is any large collection of objects or individuals, such as Americans, students, or trees about which information is desired.
- Parameter
- A parameter is any summary number, like an average or percentage, that describes the entire population.
The population mean \(\mu\) (the greek letter "mu") and the population proportion p are two different population parameters. For example:
- We might be interested in learning about \(\mu\), the average weight of all middle-aged female Americans. The population consists of all middle-aged female Americans, and the parameter is µ.
- Or, we might be interested in learning about p, the proportion of likely American voters approving of the president's job performance. The population comprises all likely American voters, and the parameter is p.
The problem is that 99.999999999999... % of the time, we don't — or can't — know the real value of a population parameter. The best we can do is estimate the parameter! This is where samples and statistics come in to play.
Samples and statistics
- Sample
- A sample is a representative group drawn from the population.
- Statistic
- A statistic is any summary number, like an average or percentage, that describes the sample.
The sample mean, \(\bar{x}\), and the sample proportion \(\hat{p}\) are two different sample statistics. For example:
- We might use \(\bar{x}\), the average weight of a random sample of 100 middle-aged female Americans, to estimate µ, the average weight of all middle-aged female Americans.
- Or, we might use \(\hat{p}\), the proportion in a random sample of 1000 likely American voters who approve of the president's job performance, to estimate p, the proportion of all likely American voters who approve of the president's job performance.
Because samples are manageable in size, we can determine the actual value of any statistic. We use the known value of the sample statistic to learn about the unknown value of the population parameter.
Example S.1.1
What was the prevalence of smoking at Penn State University before the 'no smoking' policy?
The main campus at Penn State University has a population of approximately 42,000 students. A research question is "What proportion of these students smoke regularly?" A survey was administered to a sample of 987 Penn State students. Forty-three percent (43%) of the sampled students reported that they smoked regularly. How confident can we be that 43% is close to the actual proportion of all Penn State students who smoke?
- The population is all 42,000 students at Penn State University.
- The parameter of interest is p, the proportion of students at Penn State University who smoke regularly.
- The sample is a random selection of 987 students at Penn State University.
- The statistic is the proportion, \(\hat{p}\), of the sample of 987 students who smoke regularly. The value of the sample proportion is 0.43.
Example S.1.2
Are the grades of college students inflated?
Let's suppose that there exists a population of 7 million college students in the United States today. (The actual number depends on how you define "college student.") And, let's assume that the average GPA of all of these college students is 2.7 (on a 4-point scale). If we take a random sample of 100 college students, how likely is it that the sampled 100 students would have an average GPA as large as 2.9 if the population average was 2.7?
- The population is equal to all 7 million college students in the United States today.
- The parameter of interest is µ, the average GPA of all college students in the United States today.
- The sample is a random selection of 100 college students in the United States.
- The statistic is the mean grade point average, \(\bar{x}\), of the sample of 100 college students. The value of the sample mean is 2.9.
Example S.1.3
Is there a linear relationship between birth weight and length of gestation?
Consider the relationship between the birth weight of a baby and the length of its gestation:
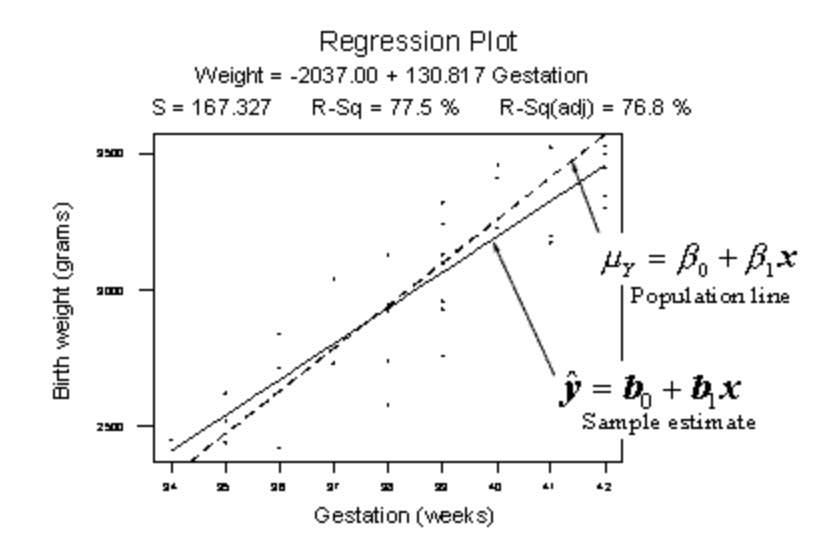
The dashed line summarizes the (unknown) relationship —\(\mu_Y = \beta_0+\beta_1x\)— between birth weight and gestation length of all births in the population. The solid line summarizes the relationship —\(\hat{y} = \beta_0+\beta_1x\)— between birth weight and gestation length in our random sample of 32 births. The goal of linear regression analysis is to use the solid line (the sample) in hopes of learning about the dashed line (the population).
Next... Confidence intervals and hypothesis tests
There are two ways to learn about a population parameter.
1) We can use confidence intervals to estimate parameters.
"We can be 95% confident that the proportion of Penn State students who have a tattoo is between 5.1% and 15.3%."
2) We can use hypothesis tests to test and ultimately draw conclusions about the value of a parameter.
"There is enough statistical evidence to conclude that the mean normal body temperature of adults is lower than 98.6 degrees F."
We review these two methods in the next two sections.