Statistical Software
Statistical SoftwareMinitab
MinitabMinitab®
A Quick Introduction to Minitab Statistical Software
This introduction to Minitab is intended to provide you with enough information to get you started using the basic functionality of Minitab. Of course, you will learn more about Minitab and its capabilities as you proceed through the course you are taking.
Obtaining a Copy of Minitab
Penn State users have access to the Minitab Web App, the cloud-based version of the software. All faculty and students who use Minitab software for coursework will need to order the Minitab Web App. See: How do I access the Minitab Web App.
Opening files in Minitab Web App
To open Minitab project files (.mpx) in the Minitab Web App go to File > Open > Project and find your Minitab project file.
To open a data file (.xlsx or .csv) in the Minitab Web App go to File > Open > Worksheet and find your data file.
You can search for files in your PSU OneDrive account, Google Drive, or from a local folder on your computer.
Analyzing Data
The Minitab Help and How-To documentation provides step-by-step instructions on using Minitab to analyze data. The individual course notes will also provide details for each specific use of Minitab within that course.
Copying Minitab Output and Graphs into Word
To copy output appearing in the Session window, select the desired output using your mouse. To copy a graph window, make the graph window active by clicking anywhere in it, and the select Edit > Copy Graph.
To paste either output or a graph, select Edit > Paste (or use the standard clipboard icon used to denote pasting).
Saving Your Work
While you can save your work in bits and pieces — the graphs separately from the worksheet —more often than not, it is best to save your entire Minitab "project." A Minitab project includes all of the work created in one session, including multiple worksheets, the Session window, and multiple graph windows. Basically, if you save your work as a Minitab project, you can resume your work right where you left off.
To save your work as a Minitab project, select File > Save Project As..., and provide an appropriate filename in the dialog box. Minitab projects are given a ".MPJ" extension. For the purpose of this course, you may consider creating one project for each lesson, and thereby naming the projects lesson1.MPJ, lesson2.MPJ, and so on.
Minitab Help
There are various ways that you can get Minitab help.
- You can look for help in the Minitab Help on-line manual also listed in the pull-down menu.
- You can use the various sets of Minitab instructions provided to you throughout the course. You will probably find links to these from the Homework Problems and Lab Activities in each lesson.
- Finally, you can post a question to a discussion in Canvas. Other students or your instructor can provide ideas and feedback.
Support From Minitab
Minitab offers several resources that are helpful for you. Minitab Support - Getting Started is a concise guide designed to quickly get you familiar with using Minitab Statistical Software.
Help
A complete Help file is incorporated in Minitab, which provides you with instructions, examples with interpretations, overviews and detailed explanations, troubleshooting tips, formulas, references, and a glossary. Open Help by choosing Help > Help or by clicking on the Help button on every dialog box in the software.
Tutorials
Step-by-step tutorials help new users learn how to use Minitab. You can open these by choosing Help > Tutorials while using Minitab.
Last, but not least, remember that Minitab provides a support team staffed by professionals with expertise in the software, statistics, quality improvement, and computer systems. Visit the Minitab support web site or call +1-814-231-2682 to speak with Minitab's technical support specialists.
PSU WebLabs
PSU WebLabsWebApps Information
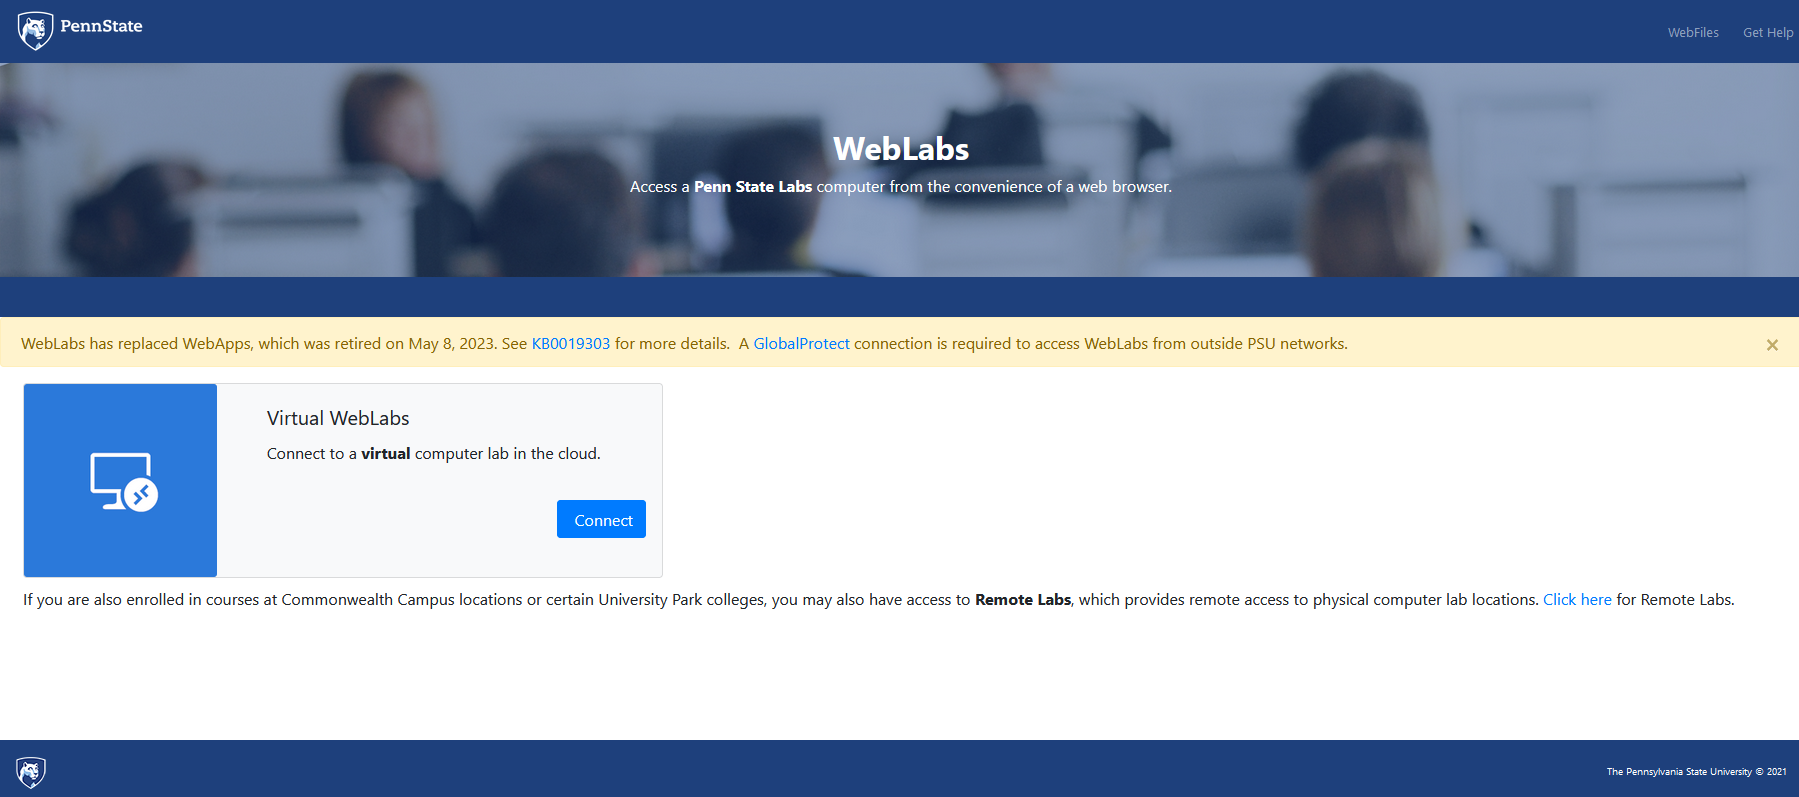
WebLabs is a service provided by Penn State that allows students to access required software remotely via the Web. This service is great if you need to use a software application and don't have access to your personal copy on your computer. You can use these applications through the web on your computer, tablet, or smartphone!
How Do I Access These Applications?
Once connected to the GlobalProtect VPN, you can now access the WebLabs website.
How is Using WebLabs Different Than Having a Local Copy?
For many reasons, it is always better to have access to your own copy of SAS, SPSS, or Minitab (or use Minitab web) on your local computer. Students committed to Statistical Consulting will want to install SAS and/or Minitab locally whenever possible. This may be a viable alternative for students in classes where SAS or Minitab is used only infrequently. Check with your course instructor to be certain.
WebLabs Do NOT Connect to Your Desktop! - only PASS space and WebFiles
WebLabs does not 'see' your desktop. Still, it will connect with your PASS space, so you MUST be familiar with uploading and managing files within your PASS space to open program files to use this version of the application successfully!
See the "How do I save files to WebFiles off campus?" knowledge base article for more details.
General Notes
Please report all problems or bugs to ITServiceDesk.
R
RR
What is R?
According to their site The R - Project for Statistical Computing:
"R is a language and environment for statistical computing and graphics."
"R provides a wide variety of statistical (linear and nonlinear modelling, classical statistical tests, time-series analysis, classification, clustering, ...) and graphical techniques, and is highly extensible."
"One of R's strengths is the ease with which well-designed publication-quality plots can be produced, including mathematical symbols and formulae where needed."
Obtaining a copy of the R applications
R is free software - see the R site above for the terms of use. It runs on a wide variety of platforms including UNIX, Windows and MacOS.
Download a copy of the most recent version of this application from their site: The R - Project for Statistical Computing
The website will require you to choose a 'CRAN Mirror'. The idea is to find the location geographically closest to you.
Launching R Programs
In R you can enter each line of code at the prompt in a step-by-step approach. You may also save R programs as simple text files to open in a separate window so that you can enter multiple lines of code at once and save your commands.
Here is an example data set you may save on your computer:
Here is an example program:
# Read data file into R as a vector
# Change pathname to wherever you saved example1.dat
example1 = scan("/Users/Shared/WD/Rdirectory/example1.dat")
# Print data
example1
# Calculate the sample mean
mean(example1)
The # symbol indicates a programmer's comment. This text is not read by the R application. This program can either be copied and pasted into the R command line, line by line or as an entire program. You may also source this program from where it is saved on your computer as shown below.
It is often useful to set a working directory so that file names without a pathname will refer to files in that directory on your system. The command getwd() will print your working directory to your screen. The command setwd("/pathname") sets the R working directory.
- On a Mac, your pathname is shown at the bottom of your Finder window,
(/Users/Username/Documents/... for example). - In Windows, the pathname is
C:/Users/Username/Documents/....
One nice feature of the step-by-step command lines in R is that you may scroll through previous commands using the Up and Down arrow keys. Here are a couple of other handy commands that you can use in R:
### to read the commands from a source file directly and to output it in the R console instead of doing it line by line or copying the source file, in the command line envoke:
source("intro.R", echo=TRUE)
#### to read the commands from a source file directly and to save the output named "example1.txt" as a text file
source("intro_file.R", echo=TRUE)
#### Within the intro_file.R program the following commands redirect all subsequent R
output to a file 'example1.txt' in addition to showing it in the R console.
sink("example1.txt", append=FALSE, split=TRUE)
sink() #### Restores normal R output behavior.
Here are the data files and programs to practice the above commands:
example1.dat, example2.txt, intro.R, intro_file.R
Data
Depending on the course, datasets are either presented within the context of the lesson or within a datasets folder. Common file extensions for data files include .dat, .csv, and .txt. You must download the data from your course website. Canvas provides instructions on how to save a file for Windows users or Mac users. A Save dialog box will be displayed and allow you to save the data file to the location you choose on your computer.
There are a number of ways to read data into your R session. Two popular commands used in the examples presented here are read.table and scan .
Install a Development Environment
The development environment is the application that you will use to open, edit, and execute R programs. If you already have a favorite development environment, you can see if it’s compatible with R (many of them are). If you don’t, we recommend one called RStudio.
Installing RStudio
- You need to have R installed first (see above)
- Download RStudio from the RStudio Website.
- Select the installer link that corresponds to your operating system (e.g. Windows, Mac OSX).
Help
If you need help understanding a command or its syntax type either ?command , or help(command) and R will display the help available on this topic. For instance, here is the help page for read.table from the command ?read.table :
Note: Certain functions in R may NOT run on all platfroms (e.g., Windows, MAC, Linux, etc..) the same way. For example, you may get an error with the sink() function on your PC depending how the read/write permissions are set up. It should not be a problem using it on Linux or a MAC, or if you run your R programs in a Terminal. In the Windows version of R, you can delete or comment-out the sink() function, and save your output by clicking on File/Save to file. You can also explore other options/functions such as file() , capture.output() , etc... You can also copy and paste your output from the R console window into a seperate file.
Helpful Resources
The Department of Statistics offers two 1 credit online courses, STAT 484: Topics in R: Statistical Language and STAT 485 - Intermediate Topics in R Statistical Language. This would be a good step towards building a solid foundation in using R. In addition, you may also find the following references handy:
- The R Project Homepage.
- DataCamp offers a free Introduction to R course and many additional courses with a subscription.
- LinkedIn Learning at PSU includes courses on R.
- R Seek helps you find the R function you require.
- R Tutorial - web site at Clarkson University Department of Mathematics.
- Swirl: Learn R, in R.
SAS
SASSAS® Information
What is SAS?
According to their site, SAS,
"SAS is the leader in business intelligence and predictive analytics software."
This application is used directly or referred to in many of the online STAT courses at Penn State.
Obtaining A Copy Of SAS
See the Statistical Software page for information regarding obtaining a copy. Please note that the SAS Student License and Media expires annually in June.
SAS can also be accessed through Penn State's WebLabs service although there are limitations to how it may be used in the web-based environment. Students are STRONGLY advised to have access to a local copy of SAS. Please contact your instructor to see if using SAS remotely will present problems with what you need to learn.
Launching SAS Programs in Our STAT Courses...
For efficiency purposes, you may sometimes find a 'Launch SAS' button to download the relevant SAS program and open it automatically using the SAS application installed on your local computer. Or, you might simply be presented with a link to the SAS program file.
Configuring your browser so that downloads open your SAS application automatically
The process of installing SAS on your local computer involves specifying and registering with your Windows operating system all of the file types that SAS will use within the SAS application. As a result, for example, Windows will place SAS-specific icons where SAS files that have the '.sas' file extension are listed.
The browser that you are using to display the lesson pages should also be able to distinguish these file types as well. The first time that you click on a link and begins downloading a file type that your computer or browser does not recognize, a dialog box will appear that will ask you whether you want to Open the file with a specific application, Save the file to a location on your computer, or cancel the download. Be sure to select the option for opening all files that have the file extension '.sas' with your SAS application. This involves finding and selecting the SAS program through this dialog box. Once this configuration is set, any time you click on a link that is a SAS file having a '.sas' extension, it will automatically launch SAS (if it isn't open already) and then open the program within the Program Editor window of your SAS application.
If you have you missed doing this the first time around you can still let your system know the preferred application you would like for a specific file type at any time. If the program code shows up in a separate window, use the File > Save Page As option and save the file to a location on your computer. Now, locate the newly saved file and right-click on it so that a dialog box similar to this appears:
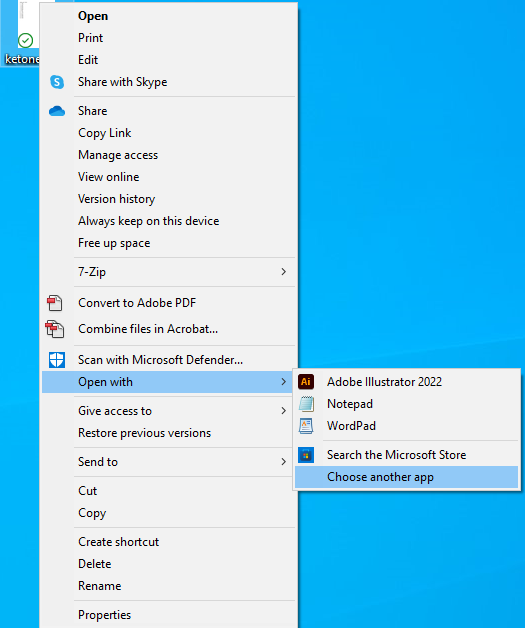
The key selection here is the Open With option. If SAS does not appear on the list, then use the Choose Program... option. You should get a dialog box that looks like this:
Be sure to check the box that we have circled in red - "Always use the selected program to open this kind of file."
You can test this using the Launch button at the bottom of this page.
Not to worry! If the configuration has not been specified, your browser will display the text of SAS program in a new window. All you need to do is copy and paste the text of this SAS program file into your SAS Program Editor window.
Configuring your computer to do this automatically provides convenience, but you always should have access to the text of the SAS program itself.
Datasets
Datasets are presented within the context of the lesson, usually found within the narrative of an example as regular links. The links are the text or data files where the data is stored. Data files typically include the file extension .txt and will open in a new window when clicked.
If you want to download and save this file to a specific location on your computer, right-click the link and select the Save Link As option (see right). A Save dialog box will be displayed and allow you to save the text file to the location you choose on your computer. Try doing it with this data set: dogs.txt.
Free SAS eLearning Resources
For Educators:
SAS provides free e-learning and training resources for professors through the SAS Educator Portal. To access these resources, educators need to create a SAS Profile using their .EDU email address. This profile will enable them to request access to the SAS Educator Portal and take advantage of its offerings.
The SAS Educator Portal is designed specifically for professors, providing them with access to a wide range of SAS resources. The wealth of resources are provided to support educators in teaching SAS to their students.
For Students:
SAS offers free e-learning and training resources for students through the SAS Skill Builder Portal. To access these resources, students must create a SAS Profile using their .EDU email address. Once they have created a profile, they can request access to the SAS Skill Builder Portal and start learning SAS.
The SAS Skill Builder Portal is designed to help students build their SAS skills and knowledge. It offers a range of resources designed so students can gain the skills they need to succeed in their academic and professional careers.
SPSS
SPSSIBM SPSS®
What is SPSS?
According to the SPSS website:
"The IBM SPSS® software platform offers advanced statistical analysis, a vast library of machine-learning algorithms, text analysis, open-source extensibility, integration with big data and seamless deployment into applications. Its ease of use, flexibility and scalability make IBM SPSS accessible to users with all skill levels and outfits projects of all sizes and complexity to help you and your organization to find new opportunities, improve efficiency and minimize risk."
Obtaining a copy of the SPSS applications
See the Statistical Software page for information regarding obtaining a copy of SPSS. Please note that the SPSS Student License and Media expires annually in August.