2.7 - Example: Are Men Getting Faster?
2.7 - Example: Are Men Getting Faster?Example 2-2: Men's 200m Data
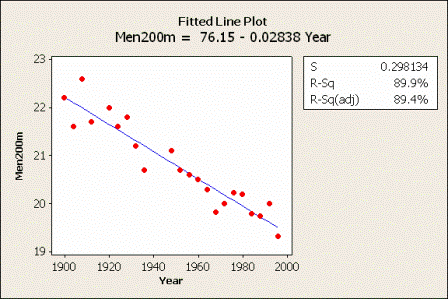
The following data set (Men's 200m data) contains the winning times (in seconds) of the 22 men's 200-meter Olympic sprints held between 1900 and 1996. (Notice that the Olympics were not held during World War I and II years.) Is there a linear relationship between the year and the winning times? The plot of the estimated regression line sure makes it look so!

To answer the research question, let's conduct the formal F-test of the null hypothesis \(H_{0}\colon \beta_{1} = 0\) against the alternative hypothesis \(H_{A}\colon \beta_{1} ≠ 0\).
The analysis of variance table, which was obtained in Minitab, has been animated to allow you to interact with the table. As you roll your mouse over the blue (or bold) numbers, you are reminded of how those numbers are determined.
| Source | DF | SS | MS | F | P |
|---|---|---|---|---|---|
| Regression | 1 | 15.8 | 15.8 | 177.7 | 0.000 |
| Residual Error | 20 | 1.8 | 0.09 | ||
| Total | 21 | 17.6 |
From a scientific point of view, what we ultimately care about is the P-value, which Minitab indicates is 0.000 (to three decimal places). That is, the P-value is less than 0.001. The P-value is very small. It is unlikely that we would have obtained such a large F* statistic if the null hypothesis were true. Therefore, we reject the null hypothesis \(H_{0}\colon \beta_{1} = 0\) in favor of the alternative hypothesis \(H_{A}\colon \beta_{1} ≠ 0\). There is sufficient evidence at the \(\alpha = 0.05\) level to conclude that there is a linear relationship between year and winning time.
Equivalence of the analysis of variance F-test and the t-test
As we noted in the first two examples, the P-value associated with the t-test is the same as the P-value associated with the analysis of variance F-test. This will always be true for the simple linear regression model. It is illustrated in the year and winning time example also. Both P-values are 0.000 (to three decimal places):
Coefficients
| Predictor | Coef | SE Coef | T-Value | P-Value |
|---|---|---|---|---|
| Constant | 76.153 | 4.152 | 18.34 | 0.000 |
| Year | -0.0284 | 0.00213 | -13.33 | 0.000 |
Analysis of Variance
| Source | DF | Adj SS | Adj MS | F-Value | P-Value |
|---|---|---|---|---|---|
| Regression | 1 | 15.796 | 15.796 | 177.7 | 0.000 |
| Residual Error | 20 | 1.778 | 0.089 | ||
| Total | 21 | 17.574 |
The P-values are the same because of a well-known relationship between a t random variable and an F random variable that has 1 numerator degree of freedom. Namely:
\((t^{*}_{(n-2)})^2=F^{*}_{(1,n-2)}\)
This will always hold for the simple linear regression model. This relationship is demonstrated in this example:
\(\left(-13.33\right)^{2} = 177.7\)
In short:
- For a given significance level \(\alpha\), the F-test of \(\beta_{1} = 0\) versus \(\beta_{1} ≠ 0\) is algebraically equivalent to the two-tailed t-test.
- We will get exactly the same P-values, so…
- If one test rejects \(H_{0}\), then so will the other.
- If one test does not reject \(H_{0}\), then so will the other.
The natural question then is ... when should we use the F-test and when should we use the t-test?
- The F-test is only appropriate for testing that the slope differs from 0 (\(\beta_{1} ≠ 0\)).
- Use the t-test to test that the slope is positive (\(\beta_{1} > 0\)) or negative (\(\beta_{1} < 0\)). Remember, though, that you will have to divide the P-value that Minitab reports by 2 to get the appropriate P-value.
The F-test is more useful for the multiple regression model when we want to test that more than one slope parameter is 0. We'll learn more about this later in the course!
Try it!
The ANOVA F-test
Height of white spruce trees
In forestry, the diameter of a tree at breast height (which is fairly easy to measure) is used to predict the height of a tree (a difficult measurement to obtain). Silviculturists working in British Columbia's boreal forest conducted a series of spacing trials to predict the heights of several species of trees. The data set White Spruce data contains the breast height diameters (in centimeters) and heights (in meters) for a sample of 36 white spruce trees.
- Is there sufficient evidence to conclude that there is a linear association between breast height diameter and tree height? Justify your response by looking at the fitted line plot and by conducting the analysis of variance F-test. In conducting the F-test, specify the null and alternative hypotheses, the significance level you used, and your final conclusion. (See Minitab Help: Creating a fitted line plot and Performing a basic regression analysis).
- Which value in the ANOVA table quantifies how far the estimated regression line is from the "no trend" line? That is, what is the particular value for this data set?
- Use the Minitab output to illustrate, for this example, the relationship between the t-test and the ANOVA F-test for testing \(H_{0} \colon \beta_{1} = 0\) against \(H_{A} \colon \beta_{1} ≠ 0\).