Minitab® – Procedure
The "basic regression analysis" command outputs:
- the estimated regression function
- a table of estimated coefficients (Coef), which also includes standard errors of the coefficients (SE Coef), and t-statistics (T) and P-values (P) for testing the parameters differ from 0
- the coefficient of determination r2
- the analysis of variance table
- a table of unusual observations
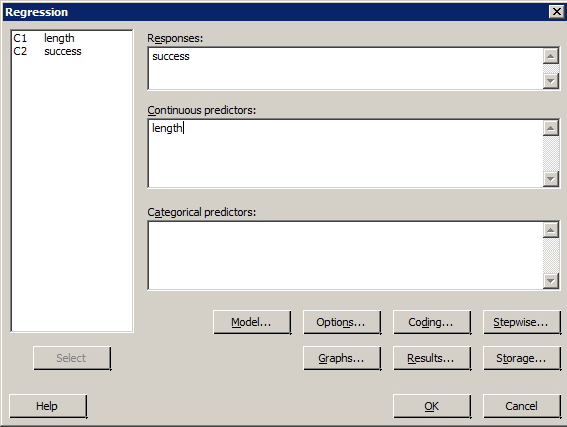
- Select Stat >> Regression >> Regression >> Fit Regression Model ...
- In the box labeled "Response", specify the desired response variable.
- In the box labeled "Predictors", specify the desired predictor variable.
- Select OK. The basic regression analysis output will be displayed in the session window.
Regression Through the Origin
To fit an RTO model click "Model" in the regular regression window and uncheck "Include the constant term in the model".
Example
Sports Illustrated published results of a study designed to determine how well professional golfers putt. The data set puttgolf.txt contains data on the lengths of putts and the percentage of successful putts made by professional golfers during 15 tournaments. Only putts that were 2 to 20 feet from the hole are included in the data set.
Is there a significant linear relationship between the response y = success and the predictor x = length?
Minitab Basic Regression Analysis Dialog Box
Sample Output
Regression Analysis: success versus length
| Analysis of Variance | |||||
|---|---|---|---|---|---|
| Source | DF | Adj SS | Adj MS | F-Value | P-Value |
| Regression | 1 | 9529 | 9529.29 | 113.28 | 0.000 |
| length | 1 | 9529 | 9529.29 | 113.28 | 0.000 |
| Error | 17 | 1430 | 84.12 | ||
| Total | 18 | 10959 | |||
| Model Summary | |||||
| S | R-sq | R-sq (adj) | R-sq(pred) | ||
| 9.17166 | 86.95% | 86.18% | 82.51% | ||
|
Regression Equation success = 83.61 - 4.089 length |
|||||
| Fits and Diagnostics for Unusual Observations | |||||
| Obs | success | Fit | Resid | Std Resid |
R |
| 1 | 93.30 | 75.43 | 17.87 | 2.17 | |
| R Large residual | |||||