Lesson 9: Data Transformations
Lesson 9: Data TransformationsOverview
In Lesson 4 and Lesson 7, we learned tools for detecting problems with a linear regression model. Once we've identified problems with the model, we have a number of options:
- If important predictor variables are omitted, see whether adding the omitted predictors improves the model.
- If the mean of the response is not a linear function of the predictors, try a different function. For example, polynomial regression involves transforming one or more predictor variables while remaining within the multiple linear regression framework. For another example, applying a logarithmic transformation to the response variable also allows for a nonlinear relationship between the response and the predictors while remaining within the multiple linear regression framework.
- If there are unequal error variances, try transforming the response and/or predictor variables or use "weighted least squares regression."
- If an outlier exists, try using a "robust estimation procedure."
- If error terms are not independent, try fitting a "time series model."
Transforming response and/or predictor variables, therefore, has the potential to remedy a number of model problems. Such data transformations are the focus of this lesson. (We cover weighted least squares and robust regression in Lesson 13 and times series models in the optional content.)
To introduce basic ideas behind data transformations we first consider a simple linear regression model in which:
- We transform the predictor (x) values only.
- We transform the response (y) values only.
- We transform both the predictor (x) values and response (y) values.
It is easy to understand how transformations work in the simple linear regression context because we can see everything in a scatterplot of y versus x. However, these basic ideas apply just as well to multiple linear regression models. With multiple predictors, we can no longer see everything in a single scatterplot, so now we use residual plots to guide us.
You will discover that data transformation definitely requires a "trial and error" approach. In building the model, we try a transformation and then check to see if the transformation eliminated the problems with the model. If it doesn't help, we try another transformation, and so on. We continue this cyclical process until we've built a model that is appropriate and we can use it. That is, the process of model building includes model formulation, model estimation, and model evaluation:
- Model building
- Model formulation
- Model estimation
- Model evaluation
- Model use
We don't leave the model-building process until we've convinced ourselves that the model meets the four conditions ("LINE") of the linear regression model. One important thing to remember is that there is often more than one viable model. The model you choose and the model a colleague chooses may be different and yet both are equally appropriate. What's important is that the model you choose:
- is not overly complicated
- meets the four conditions of the linear regression model, and
- allows you to answer your research question of interest.
Don't forget that data analysis is an artful science! It involves making subjective decisions using very objective tools!
Objectives
- Understand when transforming predictor variables might help and when transforming the response variable might help (or when it might be necessary to do both).
- Use estimated regression equations based on transformed data to answer various research questions.
- Make the calculations that are necessary to get meaningful interpretations of the slope parameter under log-transformed data.
- Use an estimated regression equation based on transformed data to predict a future response (prediction interval) or estimate a mean response (confidence interval).
Lesson 9 Code Files
Below is a zip file that contains all the data sets used in this lesson:
- allswallows.txt
- bluegills.txt
- hospital.txt
- mammgest.txt
- odor.txt
- shortleaf.txt
- wordrecall.txt
- yield.txt
9.1 - Log-transforming Only the Predictor for SLR
9.1 - Log-transforming Only the Predictor for SLRIn this section, we learn how to build and use a simple linear regression model by transforming the predictor x values. This might be the first thing that you try if you find a lack of linear trend in your data. That is, transforming the x values is appropriate when non-linearity is the only problem — the independence, normality, and equal variance conditions are met. Note, though, that it may be necessary to correct the non-linearity before you can assess the normality and equal variance assumptions. Also, while some assumptions may appear to hold prior to applying a transformation, they may no longer hold once a transformation is applied. In other words, using transformations is part of an iterative process where all the linear regression assumptions are re-checked after each iteration.
Keep in mind that although we're focussing on a simple linear regression model here, the essential ideas apply more generally to multiple linear regression models too. We can consider transforming any of the predictors by examining scatterplots of the residuals versus each predictor in turn.
Example 9-1: Word Recall
Building the model
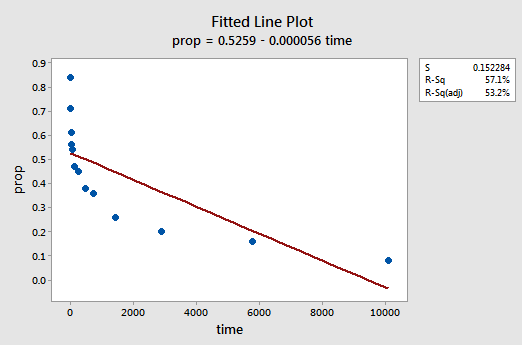
The easiest way to learn about data transformations is by example. Let's consider the data from a memory retention experiment in which 13 subjects were asked to memorize a list of disconnected items. The subjects were then asked to recall the items at various times up to a week later. The proportion of items (y = prop) correctly recalled at various times (x = time, in minutes) since the list was memorized were recorded (Word Recall data) and plotted. Recognizing that there is no good reason that the error terms would not be independent, let's evaluate the remaining three conditions — linearity, normality, and equal variances — of the model.
The resulting fitted line plot suggests that the proportion of recalled items (y) is not linearly related to time (x):
The residuals vs. fits plot also suggests that the relationship is not linear:
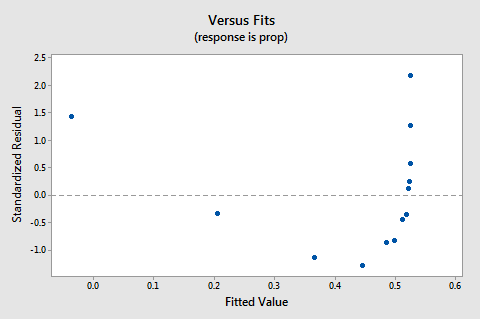
Because the lack of linearity dominates the plot, we cannot use the plot to evaluate whether or not the error variances are equal. We have to fix the non-linearity problem before we can assess the assumption of equal variances.
What about the normal probability plot of the residuals? What does it suggest about the error terms? Can we conclude that they are normally distributed?
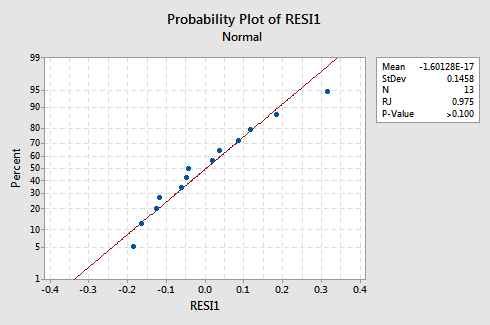
The Ryan-Joiner P-value for this example is large, which suggests that we fail to reject the null hypothesis of normal error terms. There is not enough evidence to conclude that the error terms are not normal.
In summary, we have a data set in which non-linearity is the only major problem. This situation screams out for transforming only the predictor's values. Before we do so, let's take an aside and discuss the "logarithmic transformation," since it is the most common and most useful data transformation available.
The Logarithmic Transformation
The default logarithmic transformation merely involves taking the natural logarithm — denoted \(ln\) or \(log_e\) or simply \(log\) — of each data value. One could consider taking a different kind of logarithm, such as log base 10 or log base 2. However, the natural logarithm — which can be thought of as log base e where e is the constant \(2.718282 \dots\) — is the most common logarithmic scale used in scientific work.
- The natural logarithm of x is the power of \(e = 2.718282 \dots\) that you have to take in order to get x. This can be stated notationally as \(ln\left(e^{x}\right) = x\). For example, the natural logarithm of 5 is the power to which you have to raise e = 2.718282... to get 5. Since \(2.718282^{1.60944}\) is approximately 5, we say that the natural logarithm of 5 is 1.60944. Notationally, we say \(ln\left(5\right) = 1.60944\).
- The natural logarithm of e is equal to one, that is, \(ln\left(e\right) = 1\).
- The natural logarithm of one is equal to zero, that is, \(ln\left(1\right) = 0\).
The plot of the natural logarithm function:
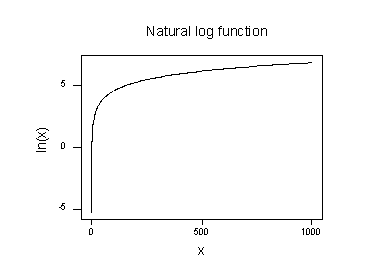
suggests that the effects of taking the natural logarithmic transformation are:
- Small values that are close together are spread further out.
- Large values that are spread out are brought closer together.
Back to the example. Let's use the natural logarithm to transform the x values in the memory retention experiment data. Since x = time is the predictor, all we need to do is take the natural logarithm of each time value appearing in the data set. In doing so, we create a newly transformed predictor called \(lntime \colon\)
| time | prop | \(\text{lntime}\) |
|---|---|---|
| 1 | 0.84 | 0.00000 |
| 5 | 0.71 | 1.60944 |
| 15 | 0.61 | 2.70805 |
| 30 | 0.56 | 3.40120 |
| 60 | 0.54 | 4.09434 |
| 120 | 0.47 | 4.78749 |
| 240 | 0.45 | 5.48064 |
| 480 | 0.38 | 6.17379 |
| 720 | 0.36 | 6.57925 |
| 1440 | 0.26 | 7.27240 |
| 2880 | 0.20 | 7.96555 |
| 5760 | 0.16 | 8.65869 |
| 10080 | 0.08 | 9.21831 |
We take the natural logarithm for each value of time and place the results in their column. That is, we "transform" each predictor time value to a \(\boldsymbol{\ln\left(\text{time}\right)}\) value. For example, \(ln\left(1\right) = 0\), \(\ln\left(5\right) = 1.60944\), and \(\ln\left(15\right) = 2.70805\), and so on.
Now that we've transformed the predictor values, let's see if it helped correct the non-linear trend in the data. We re-fit the model with \(y = prop\) as the response and \(x = lntime\) as the predictor.
The resulting fitted line plot suggests that taking the natural logarithm of the predictor values is helpful.
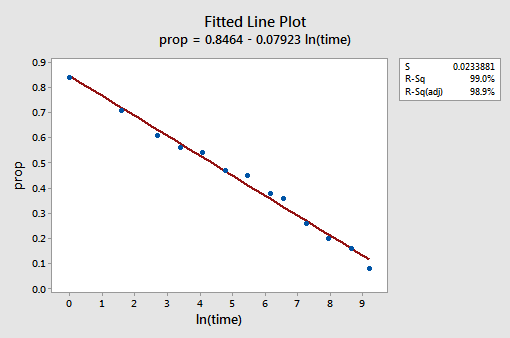
Indeed, the \(r^{2}\) value has increased from 57.1% to 99.0%. It tells us that 99% of the variation in the proportion of recalled words (prop) is reduced by taking into account the natural log of time \(\left(lntime\right)\)!
The new residual vs. fits plot shows a significant improvement over the one based on the untransformed data.
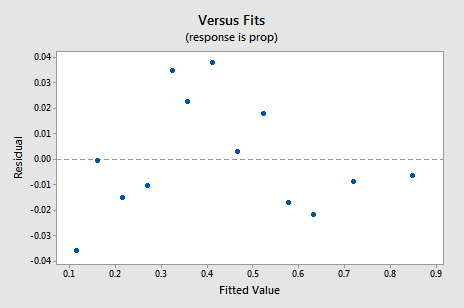
You might become concerned about some kind of an up-down cyclical trend in the plot. I caution you again not to over-interpret these plots, especially when the data set is small like this. You really shouldn't expect perfection when you resort to taking data transformations. Sometimes you have to just be content with significant improvements. By the way, the plot also suggests that it is okay to assume that the error variances are equal.
The normal probability plot of the residuals shows that transforming the x values did not affect the normality of the error terms:
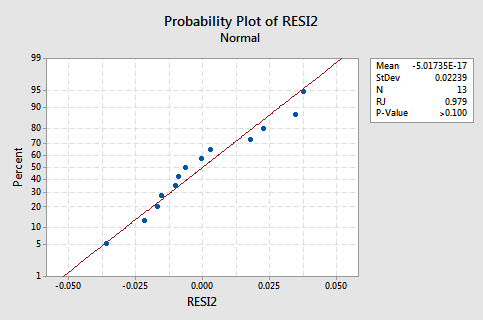
Again the Ryan-Joiner P-value is large, so we fail to reject the null hypothesis of normal error terms. There is not enough evidence to conclude that the error terms are not normal.
What if we had transformed the y values instead? Earlier I said that while some assumptions may appear to hold before applying a transformation, they may no longer hold once a transformation is applied. For example, if the error terms are well-behaved, transforming the y values could change them into badly-behaved error terms. The error terms for the memory retention data before transforming the x values appear to be well-behaved (in the sense that they appear approximately normal). Therefore, we might expect that transforming the y values instead of the x values could cause the error terms to become badly behaved. Let's take a quick look at the memory retention data to see an example of what can happen when we transform the y values when non-linearity is the only problem.
By trial and error, we discover that the power transformation of y that does the best job at correcting the non-linearity is \(y^{-1.25}\). The fitted line plot illustrates that the transformation does indeed straighten out the relationship — although admittedly not as well as the log transformation of the x values.
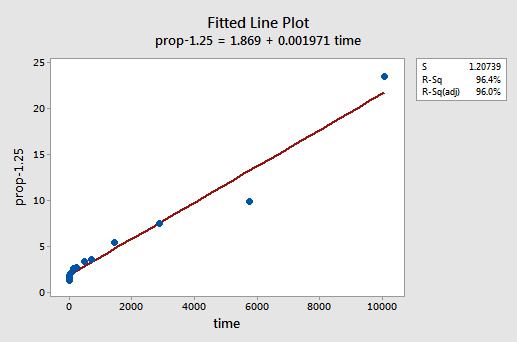
Note that the \(r^{2}\) value has increased from 57.1% to 96.4%.
The residuals show an improvement concerning non-linearity, although the improvement is not great...
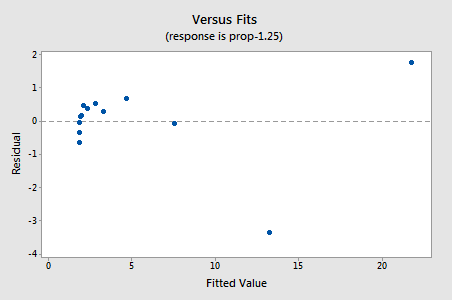
...but now we have non-normal error terms! The Ryan-Joiner P-value is smaller than 0.01, so we reject the null hypothesis of normal error terms. There is sufficient evidence to conclude that the error terms are not normal:
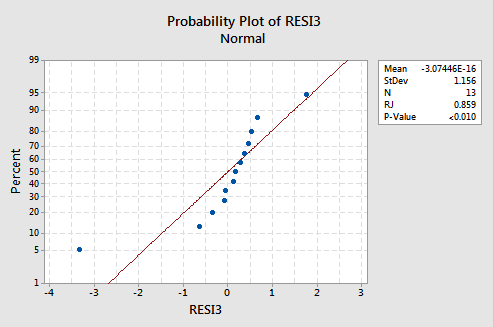
Again, if the error terms are well-behaved before transformation, transforming the y values can change them into badly-behaved error terms.
Using the Model
Once we've found the best model for our regression data, we can then use the model to answer our research questions of interest. If our model involves transformed predictor (x) values, we may or may not have to make slight modifications to the standard procedures we've already learned.
Let's use our linear regression model for the memory retention data — with \(y = prop\) as the response and \(x = lntime\) as the predictor — to answer four different research questions.
Research Question #1: What is the nature of the association between time since memorization and the effectiveness of recall?

To answer this research question, we just describe the nature of the relationship. That is, the proportion of correctly recalled words is negatively linearly related to the natural log of the time since the words were memorized. Not surprisingly, as the natural log of time increases, the proportion of recalled words decreases.
Research Question #2: Is there an association between time since memorization and the effectiveness of recall?
In answering this research question, no modification to the standard procedure is necessary. We merely test the null hypothesis \(H_0 \colon \beta_1 = 0 \) using either the F-test or the equivalent t-test:
The regression equation is
\(\widehat{prop}\) = 0.846 - 0.0792 lntime
| Predictor | Coef | SE Coef | T | P |
|---|---|---|---|---|
| Constant | 0.84642 | 0.01419 | 59.63 | 0.000 |
| lntime | -0.079227 | 0.002416 | -32.80 | 0.000 |
Model Summary
| S | R-Sq | R-Sq(adj) | R-sq(pred) |
|---|---|---|---|
| 0.02339 | 99.0% | 98.9% |
Analysis of Variance
| Source | DF | SS | MS | F | P |
|---|---|---|---|---|---|
| Regression | 1 | 0.58841 | 0.58841 | 1075.70 | 0.000 |
| Residual Error | 1 | 0.00602 | 0.00055 | ||
| Total | 12 | 0.59443 |
As the Minitab output illustrates, the P-value is < 0.001. There is significant evidence at the 0.05 level to conclude that there is a linear association between the proportion of words recalled and the natural log of the time since memorization.
Research Question #3: What proportion of words can we expect a randomly selected person to recall after 1000 minutes?
We just need to calculate a prediction interval — with one slight modification — to answer this research question. Our predictor variable is the natural log of time. Therefore, when we ask Minitab to calculate the prediction interval, we have to make sure that we specify the value of the predictor values in the transformed units, not the original units. The natural log of 1000 minutes is 6.91 log minutes. Asking Minitab to calculate a 95% prediction interval when \(lntime = 6.91\), we obtain:
Values of Predictions for New Observations
| New Obs | lntime |
|---|---|
| 1 | 6.91 |
Prediction Values for New Observations
| New Obs | Fit | SE Fit | 95% CI | 95% PI |
|---|---|---|---|---|
| 1 | 0.29896 | 0.00766 | (0.282, 0.316) | (0.245, 0.353) |
The Minitab output tells us that we can be 95% confident that, after 1000 minutes, a randomly selected person will recall between 24.5% and 35.3% of the words.
Research Question #4: How much does the expected recall change if time increases tenfold?
If you think about it, answering this research question merely involves estimating and interpreting the slope parameter \(\beta_1\). Well, not quite — there is a slight adjustment. In general, a k-fold increase in the predictor x is associated with a:
\(\beta_1 \times ln\left(k\right)\)
change in the mean of the response y.
This derivation that follows might help you understand and therefore remember this formula.
That is, a ten-fold increase in x is associated with a \(\beta_1 \times ln\left(10\right)\) change in the mean of y. And, a two-fold increase in x is associated with a \(\beta_1 \times ln\left(2\right)\) change in the mean of y.
In general, you should only use multiples of k that make sense for the scope of the model. For example, if the x values in your data set range from 2 to 8, it only makes sense to consider k multiples that are 4 or smaller. If the value of x were 2, a ten-fold increase (i.e., k = 10) would take you from 2 up to 2 × 10 = 20, a value outside the scope of the model. In the memory retention data set, the predictor values range from 1 to 10080, so there is no problem with considering a ten-fold increase.
If we are only interested in obtaining a point estimate, we merely take the estimate of the slope parameter \(\left(b_1 = -0.079227\right)\) from the Minitab output:
| Predictor | Coef | SE Coef | T | P |
|---|---|---|---|---|
| Constant | 0.84642 | 0.01419 | 59.63 | 0.000 |
| lntime | -0.079227 | 0.002416 | -32.80 | 0.000 |
and multiply it by \(ln\left(10\right)\colon\)
\(b_1 \times ln\left(10\right) = -0.079227 \times ln\left(10\right) = - 0.182\)
We expect the percentage of recalled words to decrease (since the sign is negative) by 18.2% for each ten-fold increase in the time since memorization took place.
Of course, this point estimate is of limited usefulness. How confident can we be that the estimate is close to the true unknown value? Naturally, we should calculate a 95% confidence interval. To do so, we just calculate a 95% confidence interval for \(\beta_1\) as we always have:
\( -0.079227 \pm 2.201 \left( 0.002416 \right) = \left( \boldsymbol{ -0.085, -0.074} \right)\)
and then multiply each endpoint of the interval by \(ln\left(10\right)\colon\)
\(-0.074 \times ln\left(10\right) = - \textbf{0.170} \text{ and } -0.085 \times ln\left(10\right) = - \textbf{0.l95}\)
We can be 95% confident that the percentage of recalled words will decrease between 17.0% and 19.5% for each ten-fold increase in the time since memorization took place.
9.2 - Log-transforming Only the Response for SLR
9.2 - Log-transforming Only the Response for SLRIn this section, we learn how to build and use a model by transforming the response y values. Transforming the y values should be considered when non-normality and/or unequal variances are the problems with the model. As an added bonus, the transformation on y may also help to "straighten out" a curved relationship.
Again, keep in mind that although we're focussing on a simple linear regression model here, the essential ideas apply more generally to multiple linear regression models too.
Example 9-2: Mammal Gestation
Building the model
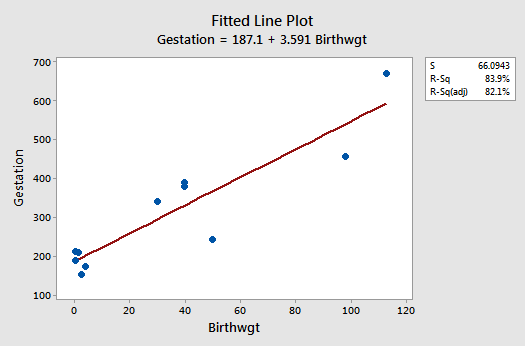
Let's consider data (Mammal Gest Data) on the typical birthweight and length of gestation for various mammals. We treat the birthweight (x, in kg) as the predictor and the length of gestation (y, in the number of days until birth) as the response.
The fitted line plot suggests that the relationship between gestation length (y) and birthweight (x) is linear, but that the variance of the error terms might not be equal:
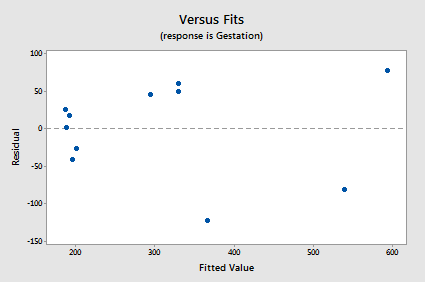
The residuals vs. fits plot exhibits some fanning and therefore provides yet more evidence that the variance of the error terms might not be equal:
The normal probability plot supports the assumption of normally distributed error terms:
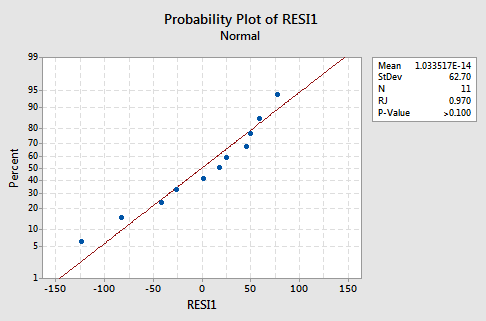
The line is approximately straight and the Ryan-Joiner P-value is large. We fail to reject the null hypothesis of normal error terms. There is not enough evidence to conclude that the error terms are not normal.
Let's transform the y values by taking the natural logarithm of the lengths of gestation. Doing so, we obtain the new response y = lnGest:
| Mammal | Birthwgt | Gestation | lnGest |
|---|---|---|---|
| Goat | 2.75 | 155 | 5.04343 |
| Sheep | 4.00 | 175 | 5.16479 |
| Deer | 0.48 | 190 | 5.24702 |
| Porcupine | 1.50 | 210 | 5.34711 |
| Bear | 0.37 | 213 | 5.36129 |
| Hippo | 50.00 | 243 | 5.49306 |
| Horse | 30.00 | 340 | 5.82895 |
| Camel | 40.00 | 380 | 5.94017 |
| Zebra | 40.00 | 390 | 5.96615 |
| Giraffe | 98.00 | 457 | 6.12468 |
| Elephant | 113.00 | 670 | 6.50728 |
For example, \(ln\left(155\right) = 5.04343\) and \(ln\left(457\right) = 6.12468\). Now that we've transformed the response y values, let's see if it helped rectify the problem with the unequal error variances.
The fitted line plot with y = lnGest as the response and x = Birthwgt as the predictor suggests that the log transformation of the response has helped:
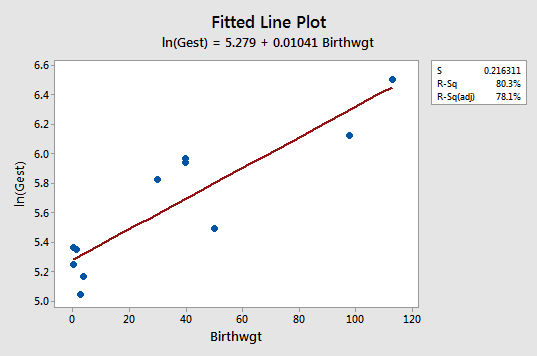
Note that, as expected, the log transformation has tended to "spread out" the smaller gestations and tended to "bring in" the larger ones.
The new residual vs. fits plot shows a marked improvement in the spread of the residuals:
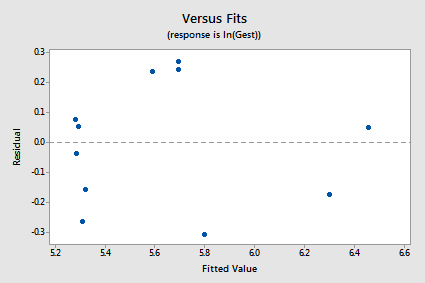
The log transformation of the response did not adversely affect the normality of the error terms:
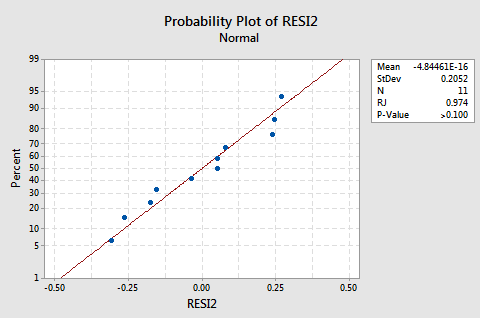
The line is approximately straight and the Ryan-Joiner P-value is large. We fail to reject the null hypothesis of normal error terms. There is not enough evidence to conclude that the error terms are not normal.
Note that the \(r^{2}\) value is lower for the transformed model than for the untransformed model (80.3% versus 83.9%). This does not mean that the untransformed model is preferable. Remember the untransformed model failed to satisfy the equal variance condition, so we should not use this model anyway.
Again, transforming the y values should be considered when non-normality and/or unequal variances are the main problems with the model.
Using the Model
We've identified what we think is the best model for the mammal birthweight and gestation data. The model meets the four "LINE" conditions. Therefore, we can use the model to answer our research questions of interest. We may or may not have to make slight modifications to the standard procedures we've already learned.
Let's use our linear regression model for the mammal birthweight and gestation data — with y = lnGest as the response and x = birthwgt as the predictor — to answer four different research questions.
Research Question #1: What is the nature of the association between mammalian birth weight and length of gestation?

Again, to answer this research question, we just describe the nature of the relationship. That is, the natural logarithm of the length of gestation is positively linearly related to birthweight. That is, as the average birthweight of the mammal increases, the expected natural logarithm of the gestation length also increases.
Research Question #2: Is there an association between mammalian birth weight and length of gestation?
Again, in answering this research question, no modification to the standard procedure is necessary. We merely test the null hypothesis \(H_0 \colon \beta_1 = 0\) using either the F-test or the equivalent t-test:
The regression equation is
\(\widehat{lnGest} = 5.28 + 0.0104 Birthwgt\)
| Predictor | Coef | SE Coef | T | P |
|---|---|---|---|---|
| Constant | 5.27882 | 0.08818 | 59.87 | 0.000 |
| Birthwgt | 0.010410 | 0.001717 | 6.06 | 0.000 |
| Model Summary | ||
|---|---|---|
| S = 0.2163 | R-Sq = 80.3% | R-Sq(adj) = 78.1% |
Analysis of Variance
| Source | DF | SS | MS | F | P |
|---|---|---|---|---|---|
| Regression | 1 | 1.7193 | 1.7193 | 36.75 | 0.000 |
| Residual Error | 9 | 0.4211 | 0.0468 | ||
| Total | 10 | 2.1405 |
As the Minitab output illustrates, the P-value is < 0.001. There is significant evidence at the 0.05 level to conclude that there is a linear association between the mammalian birthweight and the natural logarithm of the length of gestation.
Research Question #3: What is the expected gestation length of a new 50 kg mammal?
In answering this research question, if we are only interested in obtaining a point estimate, we merely enter x = 50 into the estimated regression equation:
\(ln(\widehat{Gest})=5.28+0.0104 \times Birthwgt\)
to obtain:
\(ln(\widehat{Gest})=5.28+0.0104 \times 50=5.8\)
That is, we predict the length of gestation of a 50 kg mammal to be 5.8 log days! Well, that's not very informative! We need to transform the answer back into the original units. This just requires recalling one of the fundamental properties of the natural logarithm, namely that ex and ln(x) "cancel each other out." That is:
\(\widehat{Gest}=e^{ln(\widehat{Gest})}\)
Furthermore, if we exponentiate the left side of the equation:
\(ln(\widehat{Gest})=5.28+0.0104 \times 50=5.8\)
we also have to exponentiate the right side of the equation. By doing so, we obtain:
\(\widehat{Gest}=e^{ln(\widehat{Gest})}=e^{5.8}=330.3\)
We predict the gestation length of a 50 kg mammal to be 330 days. That sounds better!
Again, a point estimate is of limited usefulness. It doesn't tell us how confident we can be that the prediction is close to the true unknown value. We should calculate a 95% prediction interval. Minitab tells us:
Values of Predictions for New Observations
| New Obs | Birthwgt |
|---|---|
| 1 | 50.0 |
Prediction Values for New Observations
| New | Fit | SE Fit | 95.0% CI | 95.0% PI |
|---|---|---|---|---|
| 1 | 5.7993 | 0.0704 | (5.6401, 5.9586) | (5.2847, 6.3139) |
that we can be 95% confident that the gestation length of a 50 kg mammal is predicted to be between 5.2847 and 6.3139 log days! Again, we need to transform these predicted limits back into the original units. By doing so, we obtain:
\(e^{5.2847} = 197.3\) and \(e^{6.3139} = 552.2\)
We can be 95% confident that the gestation length for a 50 kg mammal will be between 197.3 and 552.2 days.
Research Question #4: What is the expected change in length of gestation for each one-pound increase in birth weight?
Figuring out how to answer this research question takes a little bit of work — and some creativity, too! If you only care about the end result, this is it:
- The median of the response changes by a factor of \(e^{\beta_1}\) for each one unit increase in the predictor x. Although you won't be required to duplicate the derivation, it might help you understand—and therefore remember—the result.
- And, therefore, the median of the response changes by a factor of \(e^{k\beta_1}\) for each k-unit increase in the predictor x. Again, although you won't be required to duplicate the derivation, it might help you understand — and therefore remember — the result.
- As always, we won't know the slope of the population line, \(\beta_1\), so we'll have to use \(b_1\) to estimate it.
For the mammalian birthweight and gestation data, Minitab tells us that \(b_1 = 0.01041 \colon\)
| Predictor | Coef | SE Coef | T | P |
|---|---|---|---|---|
| Constant | 5.27882 | 0.08818 | 59.87 | 0.000 |
| Birthwgt | 0.010410 | 0.001717 | 6.06 | 0.000 |
and therefore:
\(e^{b_1}=e^{0.010410}=1.01\)
The result tells us that the predicted median gestation changes by a factor of 1.01046 for each one-unit increase in birthweight. For example, the predicted median gestation for a mammal weighing 3 kgs is 1.01046 times the median gestation for a mammal weighing 2 kgs. And, since there is a 10-unit increase going from a 20 kg to a 30 kg mammal, the median gestation for a mammal weighing 30 kgs is \(1.01046^{10} = 1.1097\) times the median gestation for a mammal weighing 20 kgs.
So far, we've only calculated a point estimate for the expected change. Of course, a 95% confidence interval for \(\beta_1\) is:
0.01041 ± 2.2622(0.001717) = (0.0065, 0.0143)
Because:
\(e^{0.0065} = 1.007\) and \(e^{0.0143} = 1.014\)
we can be 95% confident that the median gestation will increase by a factor between 1.007 and 1.014 for each one-kilogram increase in birth weight. And, since:
\(1.007^{10} = 1.072\) and \(1.014^{10} = 1.149\)
we can be 95% confident that the median gestation will increase by a factor between 1.072 and 1.149 for each 10-kilogram increase in birth weight.
9.3 - Log-transforming Both the Predictor and Response
9.3 - Log-transforming Both the Predictor and ResponseIn this section, we learn how to build and use a model by transforming both the response y and the predictor x. You might have to do this when everything seems wrong — when the regression function is not linear and the error terms are not normal and have unequal variances. In general (although not always!):
- Transforming the y values corrects problems with the error terms (and may help the non-linearity).
- Transforming the x values primarily corrects the non-linearity.
Again, keep in mind that although we're focussing on a simple linear regression model here, the essential ideas apply more generally to multiple linear regression models too.
As before, let's learn about transforming both the x and y values by way of an example.
Example 9-3: Short Leaf
Building the model
Many different interest groups — such as the lumber industry, ecologists, and foresters — benefit from being able to predict the volume of a tree just by knowing its diameter. One classic data set (Short Leaf data) — reported by C. Bruce and F. X. Schumacher in 1935 — concerned the diameter (x, in inches) and volume (y, in cubic feet) of n = 70 shortleaf pines. Let's use the data set to learn not only about the relationship between the diameter and volume of shortleaf pines, but also about the benefits of simultaneously transforming both the response y and the predictor x.
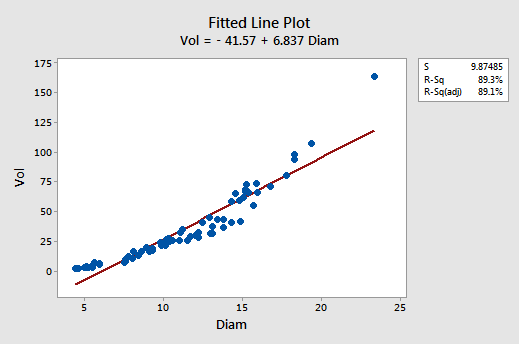
Although the \(r^{2}\) value is quite high (89.3%), the fitted line plot suggests that the relationship between tree volume and tree diameter is not linear:
The residuals vs. fits plot also suggests that the relationship is not linear:
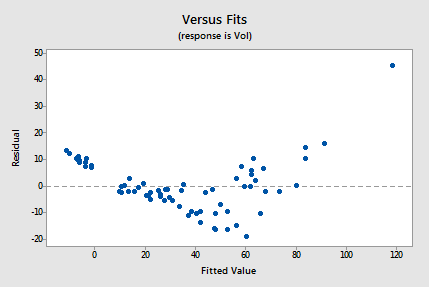
Because the lack of linearity dominates the plot, we can not use the plot to evaluate whether the error variances are equal. We have to fix the non-linearity problem before we can assess the assumption of equal variances.
The normal probability plot suggests that the error terms are not normal. The plot is not quite linear and the Ryan-Joiner P-value is small. There is sufficient evidence to conclude that the error terms are not normally distributed:
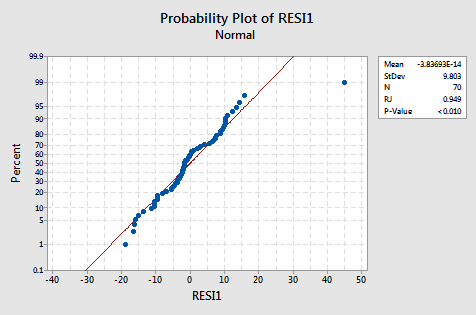
The plot actually has the classical appearance of residuals that are predominantly normal but have one outlier. This illustrates how a data point can be deemed an "outlier" just because of poor model fit.
In summary, it appears as if the relationship between tree diameter and volume is not linear. Furthermore, it appears as if the error terms are not normally distributed.
Let's see if we get anywhere by transforming only the x values. In particular, let's take the natural logarithm of the tree diameters to obtain the new predictor x = lnDiam:
| Diameter | Volume | lnDiam |
|---|---|---|
| 4.4 | 2.0 | 1.48160 |
| 4.6 | 2.2 | 1.52606 |
| 5.0 | 3.0 | 1.60944 |
| 5.1 | 4.3 | 1.62924 |
| 5.1 | 3.0 | 1.62924 |
| 5.2 | 2.9 | 1.64866 |
| 5.2 | 3.5 | 1.64866 |
| 5.5 | 3.4 | 1.70475 |
| 5.5 | 5.0 | 1.70475 |
| 5.6 | 7.2 | 1.72277 |
| 5.9 | 6.4 | 1.77495 |
| 5.9 | 5.6 | 1.77495 |
| 7.5 | 7.7 | 2.01490 |
| 7.6 | 10.3 | 2.02815 |
|
… and so on …
|
||
For example, ln(5.0) = 1.60944 and ln(7.6) = 2.02815. How well does transforming only the x values work? Not very!
The fitted line plot with y = volume as the response and x = lnDiam as the predictor suggests that the relationship is still not linear:
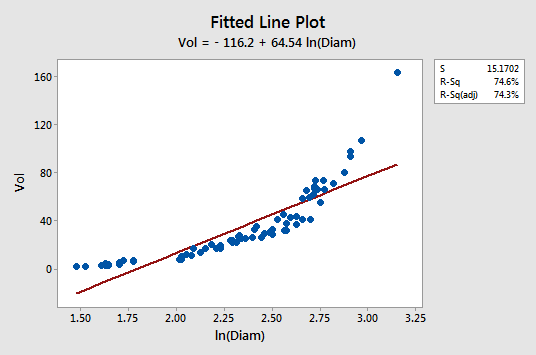
Transforming only the x values didn't change the non-linearity at all. The residuals vs. fits plot also still suggests a non-linear relationship ...
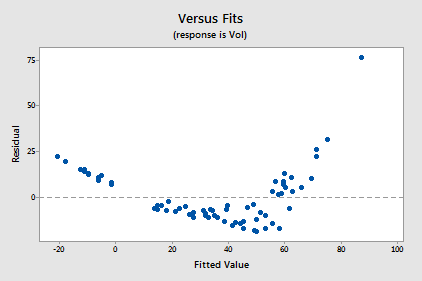
... and there is little improvement in the normality of the error terms:
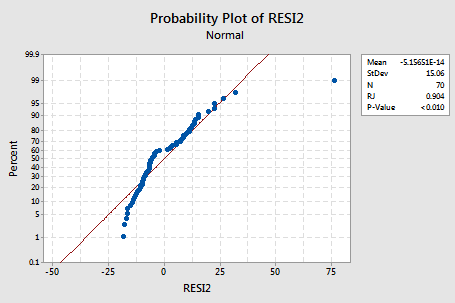
The pattern is not linear and the Ryan-Joiner P-value is small. There is sufficient evidence to conclude that the error terms are not normally distributed.
So, transforming x alone didn't help much. Let's also try transforming the response (y) values. In particular, let's take the natural logarithm of the tree volumes to obtain the new response y = lnVol:
| Diameter | Volume | lnDiam | lnVol |
|---|---|---|---|
| 4.4 | 2.0 | 1.48160 | 0.69315 |
| 4.6 | 2.2 | 1.52606 | 0.78846 |
| 5.0 | 3.0 | 1.60944 | 1.09861 |
| 5.1 | 4.3 | 1.62924 | 1.45862 |
| 5.1 | 3.0 | 1.62924 | 1.09861 |
| 5.2 | 2.9 | 1.64866 | 1.06471 |
| 5.2 | 3.5 | 1.64866 | 1.25276 |
| 5.5 | 3.4 | 1.70475 | 1.22378 |
| 5.5 | 5.0 | 1.70475 | 1.60944 |
| 5.6 | 7.2 | 1.72277 | 1.97408 |
| 5.9 | 6.4 | 1.77495 | 1.85630 |
| 5.9 | 5.6 | 1.77495 | 1.72277 |
| 7.5 | 7.7 | 2.01490 | 2.04122 |
| 7.6 | 10.3 | 2.02815 | 2.33214 |
|
... and so on ...
|
|||
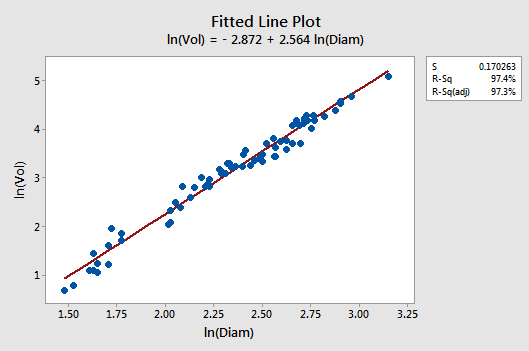
Let's see if transforming both the x and y values does it for us. Wow! The fitted line plot should give us hope! The relationship between the natural log of the diameter and the natural log of the volume looks linear and strong (\(r^{2} = 97.4\%)\colon\)
The residuals vs. fits plot provides yet more evidence of a linear relationship between lnVol and lnDiam:
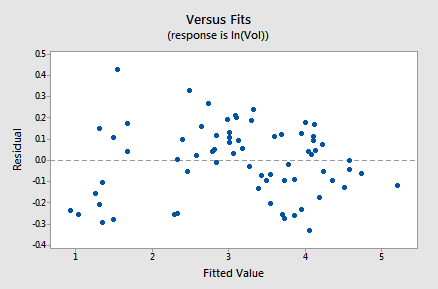
Generally, speaking the residuals bounce randomly around the residual = 0 line. You might be a little concerned that some "funneling" exists. If it does, it doesn't appear to be too severe, as the negative residuals do follow the desired horizontal band.
The normal probability plot has improved substantially:
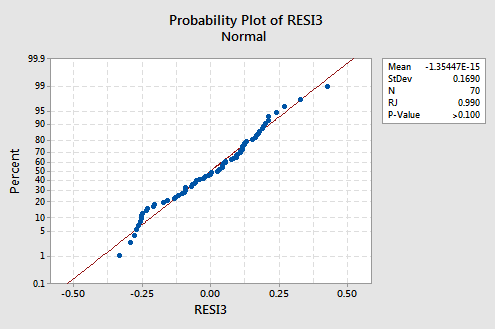
The trend is generally linear and the Ryan-Joiner P-value is large. There is insufficient evidence to conclude that the error terms are not normal.
In summary, it appears as if the model with the natural log of tree volume as the response and the natural log of tree diameter as the predictor works well. The relationship appears to be linear and the error terms appear independent and normally distributed with equal variances.
Using the Model
Let's now use our linear regression model for the shortleaf pine data — with y = lnVol as the response and x = lnDiam as the predictor — to answer four different research questions.
Research Question #1: What is the nature of the association between diameter and volume of shortleaf pines?

Again, to answer this research question, we just describe the nature of the relationship. That is, the natural logarithm of tree volume is positively linearly related to the natural logarithm of tree diameter. That is, as the natural log of tree diameters increases, the average natural logarithm of the tree volume also increases.
Research Question #2: Is there an association between the diameter and volume of shortleaf pines?
Again, in answering this research question, no modification to the standard procedure is necessary. We merely test the null hypothesis \(H_0\colon \beta_1 = 0\) using either the F-test or the equivalent t-test:
The regression equation is
\(\widehat{lnVol} = - 2.87 + 2.56 lnDiam\)
| Predictor | Coef | SE Coef | T | P |
|---|---|---|---|---|
| Constant | -2.8718 | 0.1215 | -23.63 | 0.000 |
| lnDiam | 2.56442 | 0.05120 | 50.09 | 0.000 |
| Model Summary | ||
|---|---|---|
| S = 0.1703 | R-Sq = 97.4% | R-Sq(adj) = 97.3% |
Analysis of Variance
| Source | DF | SS | MS | F | P |
|---|---|---|---|---|---|
| Regression | 1 | 72.734 | 72.734 | 2509.00 | 0.000 |
| Residual Error | 68 | 1.971 | 0.029 | ||
| Total | 69 | 74.706 |
As the Minitab output illustrates, the P-value is < 0.001. There is significant evidence at the 0.01 level to conclude that there is a linear association between the natural logarithm of tree volume and the natural logarithm of tree diameter.
Research Question #3: What is the "average" volume of all shortleaf pine trees that are 10" in diameter?
In answering this research question, if we are only interested in a point estimate, we put x = ln(10) = 2.30 into the estimated regression equation:
\(\widehat{lnVol} = - 2.87 + 2.56 lnDiam\)
to obtain:
\(\widehat{lnVol} = -2.87 + 2.56 × ln(10) = 3.025\)
That is, we estimate the average of the natural log of the volumes of all 10"-diameter shortleaf pines to be 3.025 log-cubic feet. Of course, this is not a very helpful conclusion. We have to take advantage of the fact, as we showed before, that the average of the natural log of the volumes approximately equals the natural log of the median of the volumes. Exponentiating both sides of the previous equation:
\(Vol = e^{ln \left(Vol \right)} = e^{3.025} = 20.6\) cubic feet
we estimate the median volume of all shortleaf pines with a 10" diameter to be 20.6 cubic feet. Helpful, but not sufficient! A 95% confidence interval for the average of the natural log of the volumes of all 10"-diameter shortleaf pines is:
Values of Predictions for New Observations
| New Obs | lnDiam |
|---|---|
| 1 | 2.30 |
Prediction Values for New Observations
| New | Fit | SE Fit | 95.0% CI | 95.0% PI |
|---|---|---|---|---|
| 1 | 3.030 | 0.0204 | (2.9922, 3.0738) | (2.6908, 3.3752) |
Exponentiating both endpoints of the interval, we get:
\(e^{2.9922} = 19.9\) and \(e^{3.0738} = 21.6\).
We can be 95% confident that the median volume of all shortleaf pines, 10" in diameter, is between 19.9 and 21.6 cubic feet.
Research Question #4: What is the expected change in volume for a two-fold increase in diameter?
Figuring out how to answer this research question also takes a little bit of work. The end result is:
- In general, the median changes by a factor of \(k^{\beta_1}\) for each k-fold increase in the predictor x.
- Therefore, the median changes by a factor of \(2^{\beta_1}\) for each two-fold increase in the predictor x.
- As always, we won't know the slope of the population line, \(\beta_1\). We have to use \(b_1\) to estimate it.
Again, you won't be required to duplicate the derivation, shown below, of this result, but it may help you to understand it and therefore remember it.
For the shortleaf pine data, the software output tells us that \(b_1 = 2.56442 \colon\)
| Predictor | Coef | SE Coef | T | P |
|---|---|---|---|---|
| Constant | -2.8718 | 0.1215 | -23.63 | 0.000 |
| lnDiam | 2.56442 | 0.05120 | 6.06 | 0.000 |
and therefore:
\(2^{b_1}=2^{2.56442}=5.92\)
The result tells us that the estimated median volume changes by a factor of 5.92 for each two-fold increase in diameter. For example, the median volume of a 20"-diameter tree is estimated to be 5.92 times the median volume of a 10" diameter tree. And, the median volume of a 10"-diameter tree is estimated to be 5.92 times the median volume of a 5"-diameter tree.
So far, we've only calculated a point estimate for the expected change. Of course, a 95% confidence interval for \(\beta_1\) is:
2.56442 ± 1.9955(0.05120) = (2.46, 2.67)
Because:
\(2^{2.46} = 5.50\) and \(2^{2.67} = 6.36\)
we can be 95% confident that the median volume will increase by a factor between 5.50 and 6.36 for each two-fold increase in diameter.
Example 9-4: Real Estate Air Conditioning
Recall the real estate dataset from Section 8.9: Real estate data, where
- \(Y =\) sale price of the home
- \(X_1 =\) square footage of home
- \(X_2 =\) whether the home has air conditioning or not.
The interaction model
\(y _ { i } = \beta _ { 0 } + \beta _ { 1 } x _ { i , 1 } + \beta _ { 2 } x _ { i , 2 } + \beta _ { 3 } x _ { i , 1 } x _ { i , 2 } + \varepsilon _ { i }\)
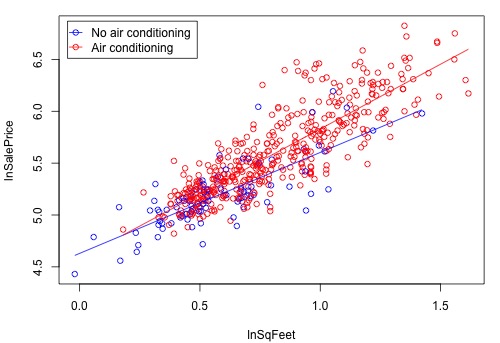
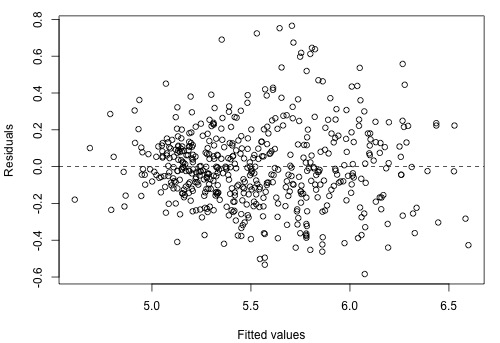
resulted in a residual plot with a megaphone pattern (i.e., an increasing variance problem). To remedy this, we'll try using log transformations for sale price and square footage (which are quite highly skewed). Now, Y = log(sale price), \(X_1 =\) log(home’s square foot area), and \(X_2 = 1\) if air conditioning present and 0 if not. After fitting the above interaction model with the transformed variables, the plot showing the regression lines is as follows:
and the residual plot, which shows a vast improvement on the residual plot in Section 8.9, is as follows:
Try It!
Transforming x and y
Transforming both the predictor x and the response y to repair problems. Hospital administrators were interested in determining how hospitalization cost (y = cost) is related to the length of stay (x = los) in the hospital. The Hospital dataset contains the reimbursed hospital costs and associated lengths of stay for a sample of 33 elderly people.
-
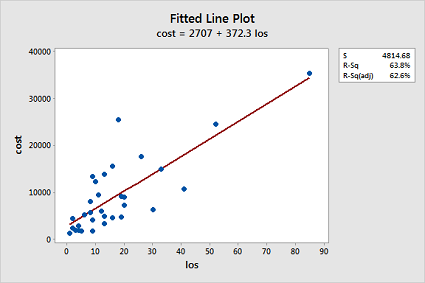
Fit a simple linear regression model using Minitab's fitted line plot command. (See Minitab Help: Creating a fitted line plot.) Does a linear function appear to fit the data well? Does the plot suggest any other potential problems with the model?
A linear function does not fit the data well since the data is clumped in the lower left corner and there appears to be an increasing variance problem:
-
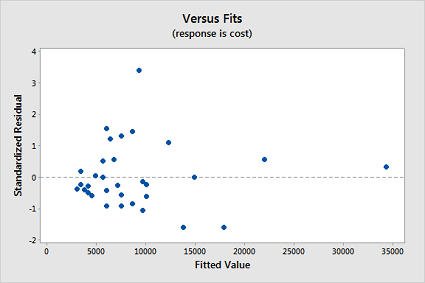
Now, fit a simple linear regression model using Minitab's regression command. In doing so, store the standardized residuals (See Minitab Help: Storing residuals (and/or influence measures)), and request a (standardized) residuals vs. fits plot. (See Minitab Help: Creating residual plots.) Interpret the residuals vs. fits plot — which model assumption does it suggest is violated?
The residual plot confirms that the "equal variance" assumption is violated:
-
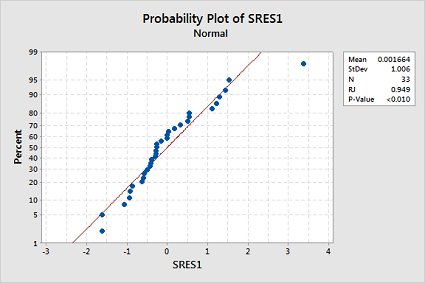
Test the normality of your stored standardized residuals using the Ryan-Joiner correlation test. (See Minitab Help: Conducting a Ryan-Joiner correlation test.) Does the test provide evidence that the residuals are not normally distributed?
The Ryan-Joiner p-value is less than 0.01, which suggests the normality assumption is violated too:
- Transform the response by taking the natural log of cost. You can use the calculator function. Select Calc >> Calculator... In the box labeled "Store result in variable", type lncost. In the box labeled Expression, use the calculator function "Natural log" or type LN('cost'). Select OK. The values of lncost should appear in the worksheet.
- Transform the predictor by taking the natural log of los. Again, you can use the calculator function. Select Calc >> Calculator... In the box labeled "Store result in variable", type lnlos. In the box labeled Expression, use the calculator function "Natural log" or type LN('los'). Select OK. The values of lnlos should appear in the worksheet.
-
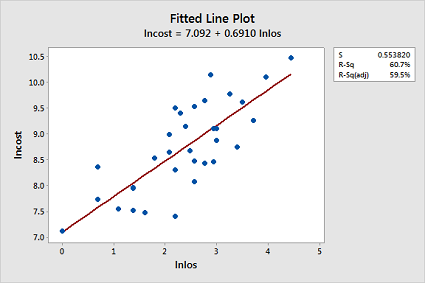
Now, fit a simple linear regression model using Minitab's fitted line plot command treating the response as lncost and the predictor as lnlos. (See Minitab Help: Creating a fitted line plot.) Does the transformation appear to have helped rectify the original problem with the model?
The transformations appear to have rectified the original problem with the model since the fitted line plot now looks ideal:
- Now, fit a simple linear regression model using Minitab's regression command treating the response as lncost and the predictor as lnlos. In doing so:
- Store the standardized residuals (See Minitab Help: Storing residuals (and/or influence measures)), and request a (standardized) residuals vs. fits plot. (See Minitab Help: Creating residual plots.)
-
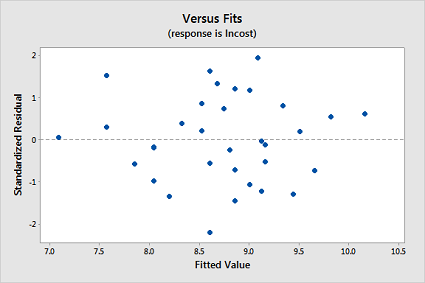
Interpret the residuals vs. fits plot — does the transformation appear to have helped rectify the original problem with the model?
The transformations appear to have rectified the original problem with the model since the residual plot also now looks ideal:
-
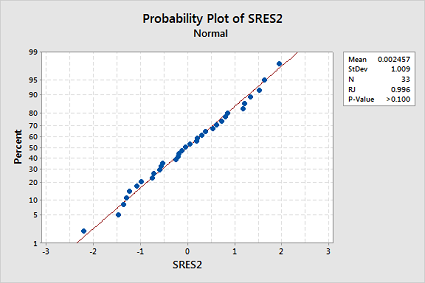
Test the normality of your new stored standardized residuals using the Ryan-Joiner correlation test. (See Minitab Help: Conducting a Ryan-Joiner correlation test.) Does the transformation appear to have helped rectify the non-normality of the residuals?
The transformations appear to have rectified the non-normality of the residuals since the Ryan-Joiner p-value is now greater than 0.1:
-
If you are satisfied that the "LINE" assumptions are met for the model based on the transformed values, you can now use the model to answer your research questions.
- Is there an association between hospitalization cost and length of stay?
- What is the expected change in hospitalization cost for each three-fold increase in length of stay?
The fitted model results are:
Model Summary
S R-sq R-sq(adj) R-sq(pred) 0.553820 60.75% 59.48% 56.65% Coefficients
Term Coef SE Coef T-Value P-Value VIF Constant 7.092 0.255 27.76 0.000 lnlos 0.6910 0.0998 6.93 0.000 1.00 - Since the p-value for lnlos is 0.000, there is significant evidence to conclude that there is a linear association between the natural logarithm of hospitalization cost and the natural logarithm of length of stay.
- Since \(3^{0.6910} = 2.14\), the estimated median cost changes by a factor of 2.14 for each three-fold increase in length of stay. A 95% confidence interval for the regression coefficient for lnlos is \(0.6910 \pm 2.03951(0.0998) = (0.487, 0.895)\), so a 95% confidence interval for this multiplicative change is \(\left(3^{0.487}, 3^{0.895} \right) = \left(1.71, 2.67 \right)\).
9.4 - Other Data Transformations
9.4 - Other Data TransformationsIs the natural log transformation the only transformation available to you? The answer is no — it just happens to be the only transformation we have investigated so far. We'll try to take care of any misconceptions about this issue in this section, in which we briefly enumerate other transformations you could try in an attempt to correct problems with your model. One thing to keep in mind though is that transforming your data almost always involves lots of trial and error. That is, there are no cut-and-dried recipes. Therefore, the best we can do is offer advice and hope that you find it helpful!
The first piece of advice
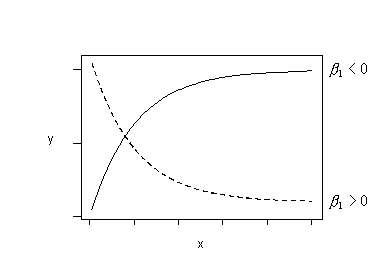
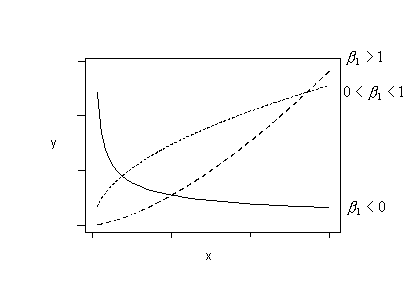
If the primary problem with your model is non-linearity, look at a scatter plot of the data to suggest transformations that might help. (This only works for simple linear regression models with a single predictor. For multiple linear regression models, look at residual plots instead.) Remember, it is possible to use transformations other than logarithms:
If the trend in your data follows either of these patterns, you could try fitting this regression function:
\(\mu_Y=\beta_0+\beta_1e^{-x}\)
to your data.
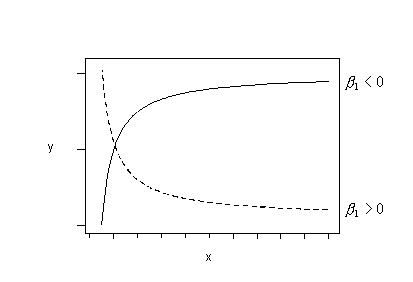
Or, if the trend in your data follows either of these patterns, you could try fitting this regression function:
\(\mu_Y=\beta_0+\beta_1\left(\frac{1}{x}\right)\)
to your data. (This is sometimes called a "reciprocal" transformation.)
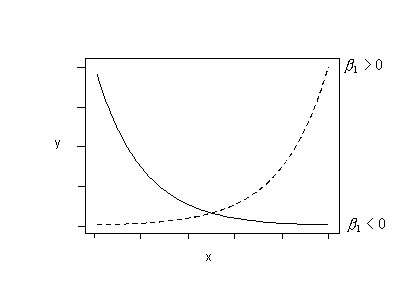
Or, if the trend in your data follows either of these patterns, try fitting this regression function:
\(\mu_{lnY}=\beta_0+\beta_1x\)
to your data. That is, fit the model with ln(y) as the response and x as the predictor.
Or, try fitting this regression function:
\(\mu_Y=\beta_0+\beta_1ln(x)\)
if the trend in your data follows either of these patterns. That is, fit the model with y as the response and ln(x) as the predictor.
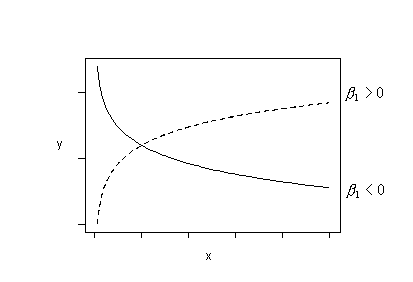
And, finally, try fitting this regression function:
\(\mu_{lnY}=\beta_0+\beta_1ln(x)\)
if the trend in your data follows any of these patterns. That is, fit the model with ln(y) as the response and ln(x) as the predictor.
The second piece of advice
If the variances are unequal and/or error terms are not normal, try a "power transformation" on y. A power transformation on y involves transforming the response by taking it to some power \(\lambda\). That is \(y^*=y^{\lambda}\). Most commonly, for interpretation reasons, \(\lambda\) is a "meaningful" number between -1 and 2, such as -1, -0.5, 0, 0.5, (1), 1.5, and 2 (i.e., it's rare to see \(\lambda=1.362,\) for example). When \(\lambda = 0\), the transformation is taken to be the natural log transformation. That is \(y^*=ln(y)\). One procedure for estimating an appropriate value for \(\lambda\) is the so-called Box-Cox Transformation, which we'll explore further in the next section.
The third piece of advice
If the error variances are unequal, try "stabilizing the variance" by transforming y:
- If the response y is a Poisson count, the variances of the error terms are not constant but rather depend on the value of the predictor. A common (now archaic?) recommendation is to transform the response using the "square root transformation," \(y^*=\sqrt{y}\), and stay within the linear regression framework. Perhaps, now, the advice should be to use "Poisson regression" (which we'll cover in the optional content).
- If the response y is a binomial proportion, the variances of the error terms are not constant but rather depend on the value of the predictor. Another common (now archaic?) recommendation is to transform the response using the "arcsine transformation," \(\hat{p}^*=sin^{-1}\left(\sqrt{\hat{p}}\right)\), and stay within the linear regression framework. Perhaps, now, the advice should be to use a form of "logistic regression" (which we'll cover in the Lesson 13).
- If the response y isn't anything special, but the error variances are unequal, a common recommendation is to try the natural log transformation \(y^*=ln(y)\) or the "reciprocal transformation" \(y^*=\frac{1}{y}\).
And two final pieces of advice...
- It's not really okay to remove some data points just to make the transformation work better, but if you do make sure you report the scope of the model.
- It's better to give up some model fit than to lose clear interpretations. Just make sure you report that this is what you did.
9.5 - More on Transformations
9.5 - More on TransformationsTransformations of the variables are used in regression to describe curvature and sometimes are also used to adjust for nonconstant variance in the errors (and y-variable).
What to Try?
When there is a curvature in the data, there might possibly be some theory in the literature on the subject matter to suggest an appropriate equation. Or, you might have to use trial and error data exploration to determine a model that fits the data. In the trial and error approach, you might try polynomial models or transformations of the x-variable(s) and/or y-variable such as square root, logarithmic, or reciprocal transformations. One of these will often end up working out.
Transform predictors or response?
In the data exploration approach, remember the following: If you transform the y-variable, you will change the variance of the y-variable and the errors. You may wish to try transformations of the y-variable (e.g., \(\ln(y)\), \(\sqrt{y}\), \(y^{-1}\)) when there is evidence of nonnormality and/or nonconstant variance problems in one or more residual plots. Try transformations of the x-variable(s) (e.g., \(x^{-1}\), \(x^{2}\), \(\ln(x)\)) when there are strong nonlinear trends in one or more residual plots. However, these guidelines don't always work. Sometimes it will be just as much art as it is science!
Why Might Logarithms Work?
If you know about the algebra of logarithms, you can verify the relationships in this section. If you don't know about the algebra of logarithms, take a leap of faith by accepting what is here as truth.
Logarithms are often used because they are connected to common exponential growth and power curve relationships. Note that here log refers to the natural logarithm. In Statistics, log and ln are used interchangeably. If any other base is ever used, then the appropriate subscript will be used (e.g., \(\log_{10}\)). The exponential growth equation for variables y and x may be written as
\(\begin{equation*} y=a\times e^{bx}, \end{equation*}\)
where a and b are parameters to be estimated. Taking natural logarithms on both sides of the exponential growth equation gives
\(\begin{equation*} \log(y)= \log(a)+bx. \end{equation*}\)
Thus, an equivalent way to express exponential growth is that the logarithm of y is a straight-line function of x.
A general power curve equation is
\(\begin{equation*} y=a\times x^{b}, \end{equation*}\)
where again a and b are parameters to be estimated. Taking logarithms on both sides of the power curve equation gives
\(\begin{equation*} \log(y)=\log(a)+b\log(x). \end{equation*}\)
Thus an equivalent way to write a power curve equation is that the logarithm of y is a straight-line function of the logarithm of x. This regression equation is sometimes referred to as a log-log regression equation.
Box-Cox Transformation
It is often difficult to determine which transformation on Y to use. Box-Cox transformations are a family of power transformations on Y such that \(Y'=Y^{\lambda}\), where \(\lambda\) is a parameter to be determined using the data. The normal error regression model with a Box-Cox transformation is
\(\begin{equation*} Y_{i}^{\lambda}=\beta_{0}+\beta _{1}X_{i}+\epsilon_{i}. \end{equation*}\)
The estimation method of maximum likelihood can be used to estimate \(\lambda\) or a simple search over a range of candidate values may be performed (e.g., \(\lambda=-4.0,-3.5,-3.0,\ldots,3.0,3.5,4.0\)). For each \(\lambda\) value, the \(Y_{i}^{\lambda}\) observations are standardized so that the analysis using the SSEs does not depend on \(\lambda\). The standardization is
\(\begin{equation*} W_{i}=\left\{\begin{array}{ll} K_{1}(Y_{i}^{\lambda}-1), \lambda \neq 0 \\ K_{2}(\log Y_{i}), \lambda =0 \end{array} \right. \end{equation*}\)
where \(K_{2}=\prod_{i=1}^{n}Y_{i}^{1/n}\) and \(K_{1 }=\frac{1}{\lambda K_{2}^{\lambda-1}}\). Once the \(W_{i}\) have been calculated for a given \(\lambda\), then they are regressed on the \(X_{i}\) and the SSE is retained. Then the maximum likelihood estimate \(\hat{\lambda}\) is that value of \(\lambda\) for which the SSE is a minimum.
9.6 - Interactions Between Quantitative Predictors
9.6 - Interactions Between Quantitative PredictorsIntroduction
We introduced interactions in the previous lesson, where we created interaction terms between indicator variables and quantitative predictors to allow for different "slopes" for levels of a categorical predictor. We can also create interaction terms between quantitative predictors, which allow the relationship between the response and one predictor to vary with the values of another predictor. Interestingly, this provides another way to introduce curvature into a multiple linear regression model. For example, consider a model with two quantitative predictors, which we can visualize in a three-dimensional scatterplot with the response values placed vertically as usual and the predictors placed along the two horizontal axes. A multiple linear regression model with just these two predictors results in a fitted regression plane that looks like a flat piece of paper. If, however, we include an interaction between the predictors in our model, then the fitted regression plane looks like a rectangular piece of paper that has been warped (with edges that slope at different angles). This creates a three-dimensional plane that has been warped, as illustrated below for the equation \(y = 3x_1 + 5x_2 + 4x_1 x_2\).
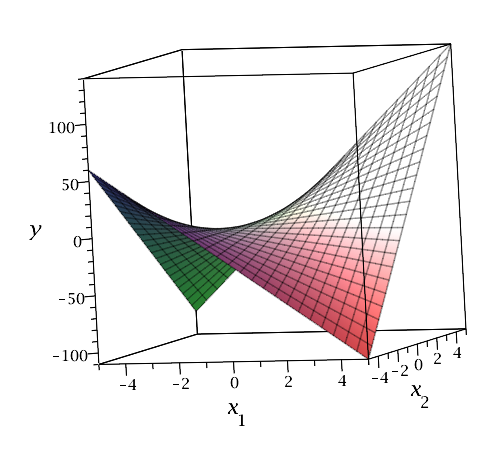
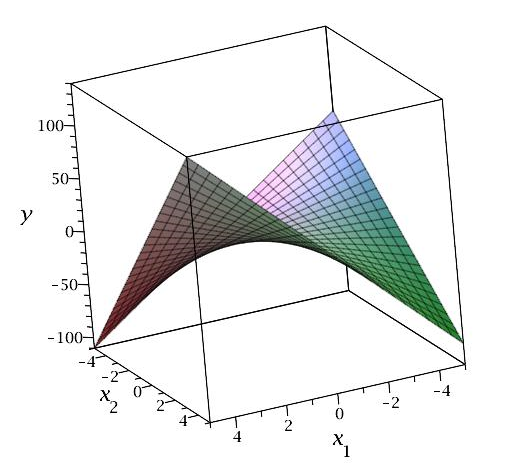
Note that for fixed \(x_1\), \(y\) is a function of \(x_2\) only, and the slopes in the cross-section vary: for example, when \(x_1 = -4\), the slope is \(5 + 4(-4) = -11\), but when \(x_1 = 4\), the slope is \(5 + 4(4) = 21\). Similarly, for fixed \(x_2\), \(y\) is a function of \(x_1\) only, and the slopes in the cross-section vary: for example, when \(x_2 = -4\), the slope is \(3 + 4(-4) = -9\), but when \(x_2 = 4\), the slope is \(3 + 4(4) = 19\).
Typically, regression models that include interactions between quantitative predictors adhere to the hierarchy principle, which says that if your model includes an interaction term, \(X_1X_2\), and \(X_1X_2\) is shown to be a statistically significant predictor of Y, then your model should also include the "main effects," \(X_1\) and \(X_2\), whether or not the coefficients for these main effects are significant. Depending on the subject area, there may be circumstances where the main effect could be excluded, but this tends to be the exception.
We can use interaction terms in any multiple linear regression model. Here we consider an example with two quantitative predictors and one indicator variable for a categorical predictor. In Lesson 5 we looked at some data resulting from a study in which the researchers (Colby, et al, 1987) wanted to determine if nestling bank swallows alter the way they breathe to survive the poor air quality conditions of their underground burrows. In reality, the researchers studied not only the breathing behavior of nestling bank swallows, but that of adult bank swallows as well.
To refresh your memory, the researchers conducted the following randomized experiment on 120 nestling bank swallows. In an underground burrow, they varied the percentage of oxygen at four different levels (13%, 15%, 17%, and 19%) and the percentage of carbon dioxide at five different levels (0%, 3%, 4.5%, 6%, and 9%). Under each of the resulting 5×4 = 20 experimental conditions, the researchers observed the total volume of air breathed per minute for each of the 6 nestling bank swallows. They replicated the same randomized experiment on 120 adult bank swallows. In this way, they obtained the following data (Swallows data) on n = 240 swallows:
- Response (y): percentage increase in "minute ventilation", (Vent), i.e., the total volume of air breathed per minute.
- Potential predictor (\(x_{1} \colon \) percentage of oxygen (O2) in the air the swallows breathe
- Potential predictor (\(x_{2} \colon \) percentage of carbon dioxide (CO2)in the air the baby birds breathe
- Potential qualitative predictor (\(x_{3} \colon \) (Type) 1 if the bird is an adult, 0 if the bird is a nestling
Here's a plot of the resulting data for the adult swallows:
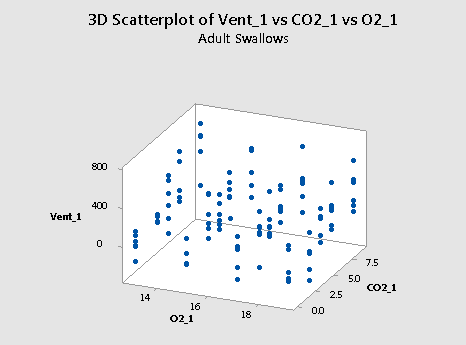
and a plot of the resulting data for the nestling bank swallows:
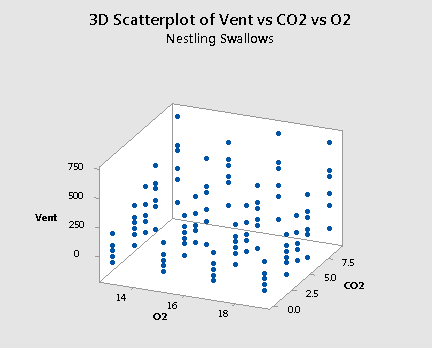
As mentioned previously, the "best fitting" function through each of the above plots will be some sort of surface like a sheet of paper. If you drag the button to the right, you will see one possible estimate of the surface for the nestlings:
What we don't know is if the best fitting function — that is, the sheet of paper — through the data will be curved or not. Including interaction terms in the regression model allows the function to have some curvature while leaving interaction terms out of the regression model forces the function to be flat.
Let's consider the research question "is there any evidence that the adults differ from the nestlings in terms of their minute ventilation as a function of oxygen and carbon dioxide?"
We could start by formulating the following multiple regression model with two quantitative predictors and one qualitative predictor:
\(y_i=(\beta_0+\beta_1x_{i1}+\beta_2x_{i2}+\beta_3x_{i3})+ \epsilon_i\)
where:
- \(y_{i}\) is the percentage of minute ventilation for swallow i
- \(x_{i1}\) is the percentage of oxygen for swallow i
- \(x_{i2}\) is the percentage of carbon dioxide for swallow i
- \(x_{i3}\) is the type of bird (0, if nestling and 1, if adult) for swallow i
and the independent error terms \(\epsilon_{i}\) follow a normal distribution with mean 0 and equal variance \(\sigma^{2}\).
We now know, however, that there is a risk in omitting an important interaction term. Therefore, let's instead formulate the following multiple regression model with three interaction terms:
\(y_i=(\beta_0+\beta_1x_{i1}+\beta_2x_{i2}+\beta_3x_{i3}+\beta_{12}x_{i1}x_{i2}+\beta_{13}x_{i1}x_{i3}+\beta_{23}x_{i2}x_{i3})+ \epsilon_i\)
where:
- \(y_{i}\) is the percentage of minute ventilation for swallow i
- \(x_{i1}\) is the percentage of oxygen for swallow i
- \(x_{i2}\) is the percentage of carbon dioxide for swallow i
- \(x_{i3}\) is the type of bird (0, if nestling and 1, if adult) for swallow i
- \(x_{i1} x_{i2}, x_{i1} x_{i3}, \text{ and } x_{i2} x_{i3} \) are interaction terms
By setting the predictor \(x_{3}\) to equal 0 and 1 and doing a little bit of algebra we see that our formulated model yields two response functions — one for each type of bird:
Type of bird | Formulated regression function |
|---|---|
If a nestling, then \(x_{i3} = 0 \) and ... | \(\mu_Y=\beta_0+\beta_1x_{i1}+\beta_2x_{i2}+\beta_{12}x_{i1}x_{i2}\) |
If an adult, then \(x_{i3} = 1 \) and ... | \(\mu_Y=(\beta_0+\beta_3)+(\beta_1+\beta_{13})x_{i1}+(\beta_2+\beta_{23})x_{i2}+\beta_{12}x_{i1}x_{i2}\) |
The \(\beta_12 x_{i1} x_{i2}\) interaction term appearing in both functions allows the two functions to have the same curvature. The additional \(\beta_{13}\) parameter appearing before the \(x_{i1}\) predictor in the regression function for the adults allows the adult function to be shifted from the nestling function in the \(x_{i1 }\) direction by \(\beta_{13}\) units. And, the additional \(\beta_{23}\) parameter appearing before the \(x_{i2}\) predictor in the regression function for the adults allows the adult function to be shifted from the nestling function in the \(x_{i2}\) direction by \(\beta_{23}\) units.
To add interaction terms to a model in Minitab click the "Model" tab in the Regression Dialog, then select the predictor terms you wish to create interaction terms for, then click "Add" for "Interaction through order 2." You should see the appropriate interaction terms added to the list of "Terms in the model." If we do this in Minitab to estimate the regression function above, we obtain:
Analysis of Variance
Source | DF | Seq SS | Seq MS | F-Value | P-Value |
|---|---|---|---|---|---|
Regression | 6 | 2387540 | 397923 | 14.51 | 0.000 |
O2 | 1 | 93651 | 93651 | 3.42 | 0.066 |
CO2 | 1 | 2247696 | 2247696 | 81.9 | 0.000 |
Type | 1 | 5910 | 5910 | 0.22 | 0.643 |
TypeO2 | 1 | 14735 | 14735 | 0.45 | 0.464 |
TypeCO2 | 1 | 2884 | 2884 | 0.11 | 0.746 |
CO2O2 | 1 | 22664 | 22664 | 0.83 | 0.364 |
Error | 233 | 6388603 | 27419 | ||
Lack-of-Fit | 33 | 485700 | 14718 | 0.50 | 0.990 |
Pure Error | 200 | 5902903 | 29515 | ||
Total | 239 | 8776143 |
Model Summary
S | R-sq | R-sq(adj) | R-sq(pred) |
|---|---|---|---|
165.587 | 27.20% | 25.33% | 22.44% |
Regression Equation
\(\widehat{Vent} = -18 + 1.19 O2 + 54.3 CO2 +112 Type - 7.01 TypeO2 + 2.31 TypeCO2 - 1.45 CO2O2\)
Again, however, we should minimize the number of hypothesis tests we perform — and thereby reduce the chance of committing a Type I error on — our data, by instead conducting a partial F-test for testing \(H_0 \colon \beta_{12} = \beta_{13} = \beta_{23} = 0\) simultaneously:
Analysis of Variance
Source | DF | SS | MS | F | P |
|---|---|---|---|---|---|
Regression | 6 | 2387540 | 397923 | 14.51 | 0.000 |
Residual Error | 233 | 6388603 | 27419 | ||
Total | 239 | 8776143 |
Source | DF | Seq SS |
|---|---|---|
O2 | 1 | 93651 |
CO2 | 1 | 2247696 |
Type | 1 | 5910 |
TypeO2 | 1 | 14735 |
TypeCO2 | 1 | 2884 |
CO2O2 | 1 | 22664 |
The Minitab output allows us to determine that the partial F-statistic is:
\(F^*=\dfrac{(14735+2884+22664)/3}{27419}=0.49\)
And the following Minitab output:
F distribution with 3 DF in numerator and 233 DF in denominator
x | P(X ≤ x) |
|---|---|
0.49 | 0.310445 |
This tells us that the probability of observing an F-statistic less than 0.49, with 3 numerator and 233 denominator degrees of freedom, is 0.31. Therefore, the probability of observing an F-statistic greater than 0.49, with 3 numerator and 233 denominator degrees of freedom, is 1-0.31 or 0.69. That is, the P-value is 0.69. There is insufficient evidence at the 0.05 level to conclude that at least one of the interaction parameters is not 0.
The residual versus fits plot:
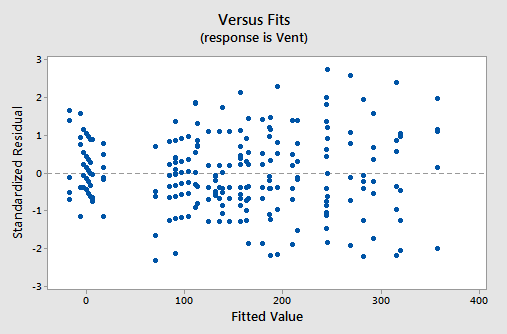
also suggests that there is something not quite right about the fit of the model containing interaction terms.
Incidentally, if we go back and re-examine the two scatter plots of the data — one for the adults:

and one for the nestlings:

we see that it is believable that there are no interaction terms. If you tried to "draw" the "best fitting" function through each scatter plot, the two functions would probably look like two parallel planes.
So, let's go back to formulating the model with no interactions terms:
\(y_i=(\beta_0+\beta_1x_{i1}+\beta_2x_{i2}+\beta_3x_{i3})+\epsilon_i\)
where:
- \(y_{i}\) is the percentage of minute ventilation for swallow i
- \(x_{i1}\) is the percentage of oxygen for swallow i
- \(x_{i2}\) is the percentage of carbon dioxide for swallow i
- \(x_{i3}\) is the type of bird (0, if nestling and 1, if adult) for swallow i
and the independent error terms \(\epsilon_{i}\) follow a normal distribution with mean 0 and equal variance \(\sigma^{2}\).
Using Minitab to estimate the regression function, we obtain:
Analysis of Variance
Source | DF | Seq SS | Seq MS | F-Value | P-Value |
|---|---|---|---|---|---|
Regression | 3 | 2347257 | 782419 | 28.72 | 0.000 |
O2 | 1 | 93651 | 93651 | 3.44 | 0.065 |
CO2 | 1 | 2247696 | 2247696 | 82.51 | 0.000 |
Type | 1 | 5910 | 5910 | 0.22 | 0.642 |
Error | 236 | 6428886 | 27241 | ||
Lack-of-Fit | 36 | 525983 | 14611 | 0.50 | 0.993 |
Pure Error | 200 | 5902903 | 29515 | ||
Total | 239 | 8776143 |
\(\widehat{Vent} = 136.8 - 8.83 O2 + 32.26 CO2 + 9.9 Type\)
Let's finally answer our primary research question: "is there any evidence that the adult swallows differ from the nestling swallows in terms of their minute ventilation as a function of oxygen and carbon dioxide?" To answer the question, we need only test the null hypothesis \(H_0 \colon \beta_3 = 0\). And, Minitab reports that the P-value is 0.642. We fail to reject the null hypothesis at any reasonable significance level. There is insufficient evidence to conclude that adult swallows differ from nestling swallows concerning their minute ventilation.
Incidentally, we should have evaluated the model, before using the model to answer the research question. All is fine, however. The residuals versus fits plot for the model with no interaction terms:
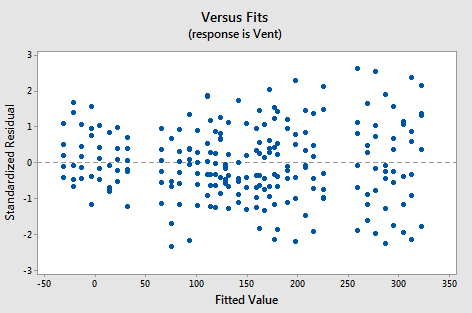
shows a marked improvement over the residuals versus fits plot for the model with the interaction terms. Perhaps there is a little bit of fanning? A little bit, but perhaps not enough to worry about.
And, the normal probability plot:
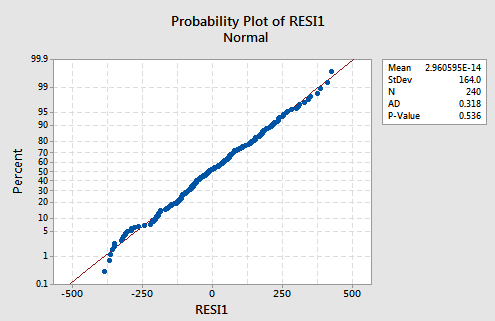
suggests there is no reason to worry about non-normal error terms.
9.7 - Polynomial Regression
9.7 - Polynomial RegressionIn our earlier discussions on multiple linear regression, we have outlined ways to check assumptions of linearity by looking for curvature in various plots.
- For instance, we look at the scatterplot of the residuals versus the fitted values.
- We also look at a scatterplot of the residuals versus each predictor.
Sometimes, a plot of the residuals versus a predictor may suggest there is a nonlinear relationship. One way to try to account for such a relationship is through a polynomial regression model. Such a model for a single predictor, X, is:
\(\begin{equation}\label{poly} Y=\beta _{0}+\beta _{1}X +\beta_{2}X^{2}+\ldots+\beta_{h}X^{h}+\epsilon, \end{equation}\)
where h is called the degree of the polynomial. For lower degrees, the relationship has a specific name (i.e., h = 2 is called quadratic, h = 3 is called cubic, h = 4 is called quartic, and so on). Although this model allows for a nonlinear relationship between Y and X, polynomial regression is still considered linear regression since it is linear in the regression coefficients, \(\beta_1, \beta_2, ..., \beta_h\)!
In order to estimate the equation above, we would only need the response variable (Y) and the predictor variable (X). However, polynomial regression models may have other predictor variables in them as well, which could lead to interaction terms. So as you can see, the basic equation for a polynomial regression model above is a relatively simple model, but you can imagine how the model can grow depending on your situation!
For the most part, we implement the same analysis procedures as done in multiple linear regression. To see how this fits into the multiple linear regression framework, let us consider a very simple data set of size n = 50 that was simulated:
| i | \(x_i\) | \(y_i\) | i | \(x_i\) | \(y_i\) | i | \(x_i\) | \(y_i\) |
|---|---|---|---|---|---|---|---|---|
| 1 | 6.6 | -45.4 | 21 | 8.4 | -106.5 | 41 | 8 | -95.8 |
| 2 | 10.1 | -176.6 | 22 | 7.2 | -63 | 42 | 8.9 | -126.2 |
| 3 | 8.9 | -127.1 | 23 | 13.2 | -362.2 | 43 | 10.1 | -179.5 |
| 4 | 6 | -31.1 | 24 | 7.1 | -61 | 44 | 11.5 | -252.6 |
| 5 | 13.3 | -366.6 | 25 | 10.4 | -194 | 45 | 12.9 | -338.5 |
| 6 | 6.9 | -53.3 | 26 | 10.8 | -216.4 | 4 | 8.1 | -97.3 |
| 7 | 9 | -131.1 | 27 | 11.9 | -278.1 | 47 | 14.9 | -480.5 |
| 8 | 12.6 | -320.9 | 28 | 9.7 | -162.7 | 48 | 13.7 | -393.6 |
| 9 | 10.6 | -204.8 | 29 | 5.4 | -21.3 | 49 | 7.8 | -87.6 |
| 10 | 10.3 | -189.2 | 30 | 12.1 | -284.8 | 50 | 8.5 | -105.4 |
| 11 | 14.1 | -421.2 | 31 | 12.1 | -287.5 | |||
| 12 | 8.6 | -113.1 | 32 | 12.1 | -290.8 | |||
| 13 | 14.9 | -482.3 | 33 | 9.2 | -137.4 | |||
| 14 | 6.5 | -42.9 | 34 | 6.7 | -47.7 | |||
| 15 | 9.3 | -144.8 | 35 | 12.1 | -292.3 | |||
| 16 | 5.2 | -14.2 | 36 | 13.2 | -356.4 | |||
| 17 | 10.7 | -211.3 | 37 | 11 | -228.5 | |||
| 18 | 7.5 | -75.4 | 38 | 13.1 | -354.4 | |||
| 19 | 14.9 | -482.7 | 39 | 9.2 | -137.2 | |||
| 20 | 12.2 | -295.6 | 40 | 13.2 | -361.6 |
The data was generated from the quadratic model
\(\begin{equation} y_{i}=5+12x_{i}-3x_{i}^{2}+\epsilon_{i}, \end{equation}\)
where the \(\epsilon_{i}s\) are assumed to be normally distributed with mean 0 and variance 2. A scatterplot of the data along with the fitted simple linear regression line is given below. As you can see, a linear regression line is not a reasonable fit to the data.
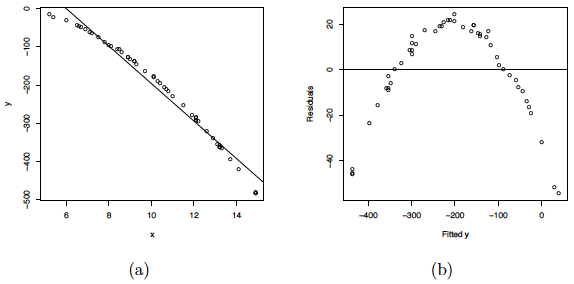
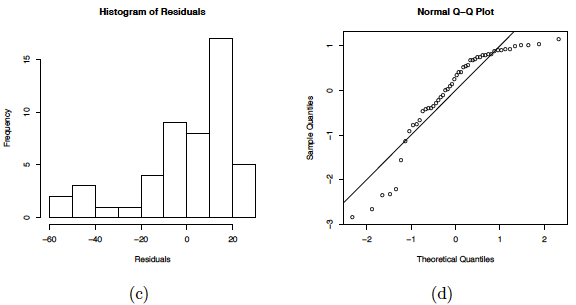
(a) Scatterplot of the quadratic data with the OLS line. (b) Residual plot for the OLS fit.
(c) Histogram of the residuals. (d) NPP for the Studentized residuals.
Residual plots of this linear regression analysis are also provided in the plot above. Notice in the residuals versus predictor plots how there is obvious curvature and it does not show uniform randomness as we have seen before. The histogram appears heavily left-skewed and does not show the ideal bell-shape for normality. Furthermore, the NPP seems to deviate from a straight line and curves down at the extreme percentiles. These plots alone suggest that there is something wrong with the model being used and indicate that a higher-order model may be needed.
The matrices for the second-degree polynomial model are:
\(\textbf{Y}=\left( \begin{array}{c} y_{1} \\ y_{2} \\ \vdots \\ y_{50} \\ \end{array} \right) \), \(\textbf{X}=\left( \begin{array}{cccc} 1 & x_{1} & x_{1}^{2} \\ 1 & x_{2} & x_{2}^{2} \\ \vdots & \vdots & \vdots \\ 1 & x_{50} & x_{50}^{2} \\ \end{array} \right)\), \(\vec{\beta}=\left( \begin{array}{c} \beta_{0} \\ \beta_{1} \\ \beta_{2} \\ \end{array} \right) \), \(\vec{\epsilon}=\left( \begin{array}{c} \epsilon_{1} \\ \epsilon_{2} \\ \vdots \\ \epsilon_{50} \\ \end{array} \right) \)
where the entries in Y and X would consist of the raw data. So as you can see, we are in a setting where the analysis techniques used in multiple linear regression (e.g., OLS) are applicable here.
Some general guidelines to keep in mind when estimating a polynomial regression model are:
- The fitted model is more reliable when it is built on a larger sample size n.
- Do not extrapolate beyond the limits of your observed values, particularly when the polynomial function has a pronounced curve such that an extraploation produces meaningless results beyond the scope of the model.
- Consider how large the size of the predictor(s) will be when incorporating higher degree terms as this may cause numerical overflow for the statistical software being used.
- Do not go strictly by low p-values to incorporate a higher degree term, but rather just use these to support your model only if the resulting residual plots looks reasonable. This is an example of a situation where you need to determine "practical significance" versus "statistical significance".
- In general, as is standard practice throughout regression modeling, your models should adhere to the hierarchy principle, which says that if your model includes \(X^{h}\) and \(X^{h}\) is shown to be a statistically significant predictor of Y, then your model should also include each \(X^{j}\) for all \(j<h\), whether or not the coefficients for these lower-order terms are significant.
9.8 - Polynomial Regression Examples
9.8 - Polynomial Regression ExamplesExample 9-5: How is the length of a bluegill fish related to its age?
In 1981, n = 78 bluegills were randomly sampled from Lake Mary in Minnesota. The researchers (Cook and Weisberg, 1999) measured and recorded the following data (Bluegills dataset):
- Response \(\left(y \right) \colon\) length (in mm) of the fish
- Potential predictor \(\left(x_1 \right) \colon \) age (in years) of the fish
The researchers were primarily interested in learning how the length of a bluegill fish is related to its age.
A scatter plot of the data:
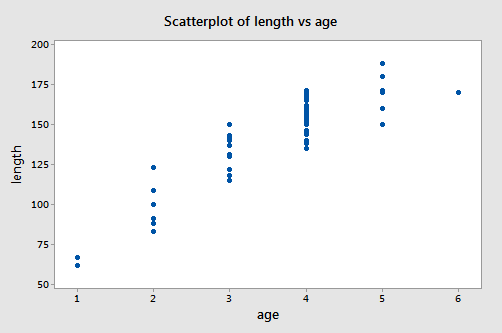
suggests that there is a positive trend in the data. Not surprisingly, as the age of bluegill fish increases, the length of the fish tends to increase. The trend, however, doesn't appear to be quite linear. It appears as if the relationship is slightly curved.
One way of modeling the curvature in these data is to formulate a "second-order polynomial model" with one quantitative predictor:
\(y_i=(\beta_0+\beta_1x_{i}+\beta_{11}x_{i}^2)+\epsilon_i\)
where:
- \(y_i\) is length of bluegill (fish) \(i\) (in mm)
- \(x_i\) is age of bluegill (fish) \(i\) (in years)
and the independent error terms \(\epsilon_i\) follow a normal distribution with mean 0 and equal variance \(\sigma^{2}\).
You may recall from your previous studies that the "quadratic function" is another name for our formulated regression function. Nonetheless, you'll often hear statisticians referring to this quadratic model as a second-order model, because the highest power on the \(x_i\) term is 2.
Incidentally, observe the notation used. Because there is only one predictor variable to keep track of, the 1 in the subscript of \(x_{i1}\) has been dropped. That is, we use our original notation of just \(x_i\). Also note the double subscript used on the slope term, \(\beta_{11}\), of the quadratic term, as a way of denoting that it is associated with the squared term of the one and only predictor.
The estimated quadratic regression equation looks like it does a pretty good job of fitting the data:
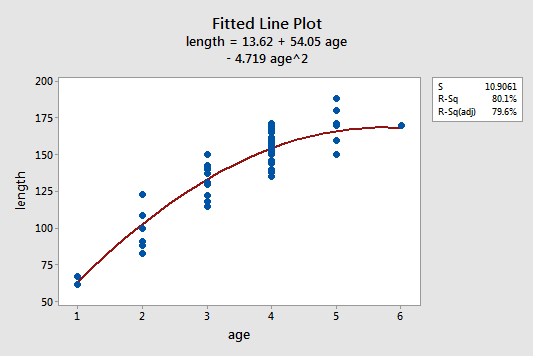
To answer the following potential research questions, do the procedures identified in parentheses seem reasonable?
- How is the length of a bluegill fish related to its age? (Describe the "quadratic" nature of the regression function.)
- What is the length of a randomly selected five-year-old bluegill fish? (Calculate and interpret a prediction interval for the response.)
Among other things, the Minitab output:
Analysis of Variance
| Source | DF | Adj SS | Adj MS | F-Value | P-Value |
|---|---|---|---|---|---|
| Regression | 2 | 35938.0 | 17969.0 | 151.07 | 0.000 |
| age | 1 | 8252.5 | 8252.5 | 69.38 | 0.000 |
| age^2 | 1 | 2972.1 | 2972.1 | 24.99 | 0.000 |
| Error | 75 | 8920.7 | 118.9 | ||
| Lack-of-Fit | 3 | 108.0 | 360 | 0.29 | 0.829 |
| Pure Error | 72 | 88121.7 | 122.4 | ||
| Total | 77 | 44858.7 |
Model Summary
| S | R-sq | R-sq(adj) | R-sq(pred) |
|---|---|---|---|
| 10.9061 | 80.11% | 79.58% | 78.72% |
Coefficients
| Term | Coef | SE Coef | T-Value | P-Value | VIF |
|---|---|---|---|---|---|
| Constant | 13.6 | 11.0 | 1.24 | 0.220 | |
| age | 54.05 | 6.49 | 8.33 | 0.000 | 23.44 |
| age^2 | -4.719 | 0.944 | -5.00 | 0.000 | 23.44 |
Regression Equation
\(\widehat{length} = 13.6 + 54.05 age - 4.719 age^2\)
Predictions for length
| Variable | Setting |
|---|---|
| age | 5 |
| age^2 | 25 |
| Fit | SE Fit | 95% CI | 95% PI |
|---|---|---|---|
| 165.902 | 2.76901 | (160.386, 171.418) | (143.487, 188.318) |
tells us that:
- 80.1% of the variation in the length of bluegill fish is reduced by taking into account a quadratic function of the age of the fish.
- We can be 95% confident that the length of a randomly selected five-year-old bluegill fish is between 143.5 and 188.3 mm.
Example 9-6: Yield Data Set
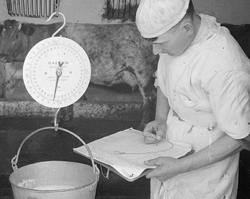
This data set of size n = 15 (Yield data) contains measurements of yield from an experiment done at five different temperature levels. The variables are y = yield and x = temperature in degrees Fahrenheit. The table below gives the data used for this analysis.
| i | Temperature | Yield |
|---|---|---|
| 1 | 50 | 3.3 |
| 2 | 50 | 2.8 |
| 3 | 50 | 2.9 |
| 4 | 70 | 2.3 |
| 5 | 70 | 2.6 |
| 6 | 70 | 2.1 |
| 7 | 80 | 2.5 |
| 8 | 80 | 2.9 |
| 9 | 80 | 2.4 |
| 10 | 90 | 3.0 |
| 11 | 90 | 3.1 |
| 12 | 90 | 2.8 |
| 13 | 100 | 3.3 |
| 14 | 100 | 3.5 |
| 15 | 100 | 3.0 |
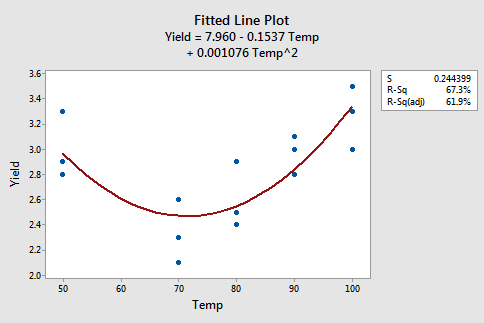
The figures below give a scatterplot of the raw data and then another scatterplot with lines pertaining to a linear fit and a quadratic fit overlayed. Obviously, the trend of this data is better suited to a quadratic fit.
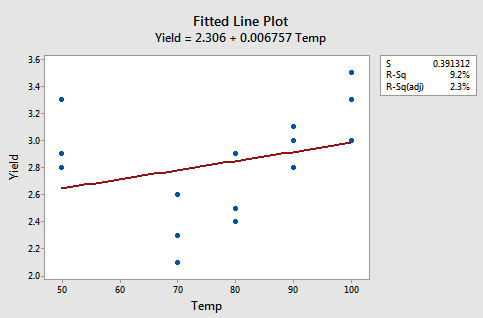
Here we have the linear fit results:
Regression Analysis: Yield versus Temp
Model Summary
| S | R-sq | R-sq(adj) | R-sq(pred) |
|---|---|---|---|
| 0.391312 | 9.24% | 2.26% | 0.00% |
Coefficients
| Term | Coef | SE Coef | T-Value | P-Value | VIF |
|---|---|---|---|---|---|
| Constant | 2.306 | 0.469 | 4.92 | 0.000 | |
| Temp | 0.00676 | 0.00587 | 1.15 | 0.271 | 1.00 |
Regression Equation
\(\widehat{Yield} = 2.306 + 0.00676 Temp\)
Here we have the quadratic fit results:
Polynomial Regression Analysis: Yield versus Temp
Model Summary
| S | R-sq | R-sq(adj) | R-sq(pred) |
|---|---|---|---|
| 0.244399 | 67.32% | 61.87% | 46.64% |
Coefficients
| Term | Coef | SE Coef | T-Value | P-Value | VIF |
|---|---|---|---|---|---|
| Constant | 7.96 | 1.26 | 6.32 | 0.000 | |
| Temp | -0.1537 | 0.0349 | -4.40 | 0.001 | 90.75 |
| Temp*Temp | 0.001076 | 0.000233 | 4.62 | 0.001 | 90.75 |
Regression Equation
\(\widehat{Yield} =7.96 - 0.1537 Temp + 0.001076 Temp*Temp\)
We see that both temperature and temperature squared are significant predictors for the quadratic model (with p-values of 0.0009 and 0.0006, respectively) and that the fit is much better than the linear fit. From this output, we see the estimated regression equation is \(y_{i}=7.960-0.1537x_{i}+0.001076x_{i}^{2}\). Furthermore, the ANOVA table below shows that the model we fit is statistically significant at the 0.05 significance level with a p-value of 0.001.
Analysis of Variance
| Source | DF | Adj SS | Adj MS | F-Value | P-Value |
|---|---|---|---|---|---|
| Regression | 2 | 1.47656 | 0.738282 | 12.36 | 0.001 |
| Temp | 1 | 1.1560 | 1.15596 | 19.35 | 0.001 |
| Temp*Temp | 1 | 1.2739 | 1.27386 | 21.33 | 0.001 |
| Error | 12 | 0.71677 | 0.059731 | ||
| Lack-of-Fit | 2 | 0.1368 | 0.06838 | 1.18 | 0.347 |
| Pure Error | 10 | 0.5800 | 0.05800 | ||
| Total | 14 | 21.9333 |
Example 9-7: Odor Data Set
An experiment is designed to relate three variables (temperature, ratio, and height) to a measure of odor in a chemical process. Each variable has three levels, but the design was not constructed as a full factorial design (i.e., it is not a \(3^{3}\) design). Nonetheless, we can still analyze the data using a response surface regression routine, which is essentially polynomial regression with multiple predictors. The data obtained (Odor data) was already coded and can be found in the table below.
| Odor | Temperature | Ratio | Height |
|---|---|---|---|
| 66 | -1 | -1 | 0 |
| 58 | -1 | 0 | -1 |
| 65 | 0 | -1 | -1 |
| -31 | 0 | 0 | 0 |
| 39 | 1 | -1 | 0 |
| 17 | 1 | 0 | -1 |
| 7 | 0 | 1 | -1 |
| -35 | 0 | 0 | 0 |
| 43 | -1 | 1 | 0 |
| -5 | -1 | 0 | 1 |
| 43 | 0 | -1 | 1 |
| -26 | 0 | 0 | 0 |
| 49 | 1 | 1 | 0 |
| -40 | 1 | 0 | 1 |
| -22 | 0 | 1 | 1 |
First, we will fit a response surface regression model consisting of all of the first-order and second-order terms. The summary of this fit is given below:
Model Summary
| S | R-sq | R-sq(adj) | R-sq(pred) |
|---|---|---|---|
| 18.7747 | 86.83% | 76.95% | 47.64% |
Coefficients
| Term | Coef | SE Coef | T-Value | P-Value | VIF |
|---|---|---|---|---|---|
| Constant | -30.7 | 10.8 | -2.83 | 0.022 | |
| Temp | -12.13 | 6.64 | -1.83 | 0.105 | 1.00 |
| Ratio | -17.00 | 6.64 | -2.56 | 0.034 | 1.00 |
| Height | -21.37 | 6.64 | -3.22 | 0.012 | 1.00 |
| Temp2 | 32.08 | 9.77 | 3.28 | 0.011 | 1.01 |
| Ratio2 | 47.83 | 9.77 | 4.90 | 0.001 | 1.01 |
| Height2 | 6.08 | 9.77 | 0.62 | 0.551 | 1.01 |
As you can see, the square of height is the least statistically significant, so we will drop that term and rerun the analysis. The summary of this new fit is given below:
Model Summary
| S | R-sq | R-sq(adj) | R-sq(pred) |
|---|---|---|---|
| 18.1247 | 86.19% | 78.52% | 56.19% |
Coefficients
| Term | Coef | SE Coef | T-Value | P-Value | VIF |
|---|---|---|---|---|---|
| Constant | -26.92 | 8.71 | -3.09 | 0.013 | |
| Temp | -12.13 | 6.41 | -1.89 | 0.091 | 1.00 |
| Ratio | -17.00 | 6.41 | -2.65 | 0.026 | 1.00 |
| Height | -21.37 | 6.41 | -3.34 | 0.009 | 1.00 |
| Temp2 | 31.62 | 9.40 | 3.36 | 0.008 | 1.01 |
| Ratio2 | 47.37 | 9.40 | 5.04 | 0.001 | 1.01 |
The temperature main effect (i.e., the first-order temperature term) is not significant at the usual 0.05 significance level. However, the square of temperature is statistically significant. To adhere to the hierarchy principle, we'll retain the temperature main effect in the model.
Software Help 9
Software Help 9
The next two pages cover the Minitab and R commands for the procedures in this lesson.
Below is a zip file that contains all the data sets used in this lesson:
- allswallows.txt
- bluegills.txt
- hospital.txt
- mammgest.txt
- odor.txt
- shortleaf.txt
- wordrecall.txt
- yield.txt
Minitab Help 9: Data Transformations
Minitab Help 9: Data TransformationsMinitab®
Word recall (log-transforming a predictor)
- Perform a linear regression analysis of prop on time.
- Create a fitted line plot.
- Create residual plots and select "Residuals versus fits" (with regular residuals).
- Conduct regression error normality tests and select Anderson-Darling.
- To create a log(time) variable, select Calc > Calculator, specify the name of the new variable (lntime, for example) in the box labeled "Store result in variable," and type "log(time)" in the box labeled "Expression." Select OK and the new variable should appear in your worksheet.
- Perform a linear regression analysis of prop on log(time).
- Repeat diagnostic plots and normality tests.
- Use Calc > Calculator to create a prop^-1.25 variable and Perform a linear regression analysis of prop^-1.25 on time.
- Repeat diagnostic plots and normality tests.
- Use prop on log(time) model to find:
- 95% prediction interval for a prop at time 1000. Use Find a confidence interval and a prediction interval for the response and specify 6.91 for the individual value of log(time).
- 95% confidence interval for the expected change in prop for a 10-fold increase in time. To display confidence intervals for the model parameters (regression coefficients) click "Results" in the Regression Dialog and select "Expanded tables" for "Display of results."
Mammal gestation (log-transforming the response)
- Perform a linear regression analysis of Gestation on Birthwgt.
- Create a fitted line plot.
- Create residual plots and select "Residuals versus fits" (with regular residuals).
- Conduct regression error normality tests and select Anderson-Darling.
- Use Calc > Calculator to create a log(Gestation) variable and Perform a linear regression analysis of log(Gestation) on Birthwgt.
- Repeat diagnostic plots and normality tests.
- Use log(Gestation) on Birthwgt model to find:
- 95% prediction interval for Gestation for a Birthwgt of 50. Use Find a confidence interval and a prediction interval for the response.
- 95% confidence interval for proportional change in median Gestation for a 1-pound increase in Birthwgt. To display confidence intervals for the model parameters (regression coefficients) click "Results" in the Regression Dialog and select "Expanded tables" for "Display of results."
- 95% confidence interval for proportional change in median Gestation for a 10-pound increase in Birthwgt.
Shortleaf pine trees (log-transforming both response and predictor)
- Perform a linear regression analysis of Vol on Diam.
- Create a fitted line plot.
- Create residual plots and select "Residuals versus fits" (with regular residuals).
- Conduct regression error normality tests and select Anderson-Darling.
- Use Calc > Calculator to create a log(Diam) variable and Perform a linear regression analysis of Vol on log(Diam).
- Repeat diagnostic plots and normality tests.
- Use Calc > Calculator to create a log(Vol) variable and Perform a linear regression analysis of log(Vol) on log(Diam).
- Repeat diagnostic plots and normality tests.
- Use log(Vol) on log(Diam) model to find:
- 95% confidence interval for median Vol for a Diam of 10. Use Find a confidence interval and a prediction interval for the response and specify 2.303 for the individual value of log(Diam).
- 95% confidence interval for proportional change in median Vol for a 2-fold increase in Diam. To display confidence intervals for the model parameters (regression coefficients) click "Results" in the Regression Dialog and select "Expanded tables" for "Display of results."
Underground air quality (interactions)
- Select Graph > 3D Scatterplot (Simple) to create a 3D scatterplot of the data.
- Create interaction variables and Perform a linear regression analysis of Vent on O2 + CO2 + Type + TypeO2 + TypeCO2 + CO2O2.
- Alternatively, Perform a linear regression analysis of Vent on O2 + CO2 + Type, but before clicking "OK," click "Model," select O2, CO2, and Type in the "Predictors" box, change "Interactions through order" to "2" and click "Add." You should see "Type*O2," "Type*CO2," and "CO2*O2" appear in the box labeled "Terms in the model."
- Click "Options" in the regression dialog to select Sequential (Type I) sums of squares for the Anova table.
- Calculate partial F-statistic by hand and Find an F-based P-value.
- Create residual plots and select "Residuals versus fits" (with regular residuals).
- Perform a linear regression analysis of Vent on O2 + CO2 + Type.
- Create residual plots and select "Residuals versus fits" (with regular residuals).
- Conduct regression error normality tests and select Anderson-Darling.
Bluegill fish (polynomial regression)
- Create a basic scatterplot.
- Use Calc > Calculator to create an age-squared variable and Perform a linear regression analysis of length on age + agesq.
- Alternatively, Perform a linear regression analysis of length on age, but before clicking "OK," click "Model," change "Terms through order" to "2" and click "Add." You should see "age*age" appear in the box labeled "Terms in the model."
- Create a fitted line plot and select "Quadratic" for the "Type of regression model."
- Find a confidence interval and a prediction interval for the response.
Experiment yield (polynomial regression)
- Perform a linear regression analysis of Yield on Temp.
- Create a fitted line plot.
- Use Calc > Calculator to create a Temp-squared variable and Perform a linear regression analysis of Yield on Temp + Tempsq.
- Alternatively, Perform a linear regression analysis of Yield on Temp, but before clicking "OK," click "Model," change "Terms through order" to "2" and click "Add." You should see "Temp* Temp" appear in the box labeled "Terms in the model."
- Create a fitted line plot and select "Quadratic" for the "Type of regression model."
Chemical odor (polynomial regression)
- Use Calc > Calculator to create squared variables and Perform a linear regression analysis of Odor on Temp + Ratio + Height + Tempsq + Ratiosq + Heightsq.
- Alternatively, Perform a linear regression analysis of Odor on Temp + Ratio + Height, but before clicking "OK," click "Model," select Temp, Ratio, and Height in the "Predictors" box, change "Terms through order" to "2" and click "Add." You should see "Temp* Temp," "Ratio*Ratio," and "Height*Height" appear in the box labeled "Terms in the model."
- Perform a linear regression analysis of Odor on Temp + Ratio + Height + Tempsq + Ratiosq (remove the "Height*Height" term by clicking "Model," selecting "Height*Height" in the box labeled "Terms in the model," and clicking "X").
R Help 9: Data Transformations
R Help 9: Data TransformationsR Help
Word recall (log-transforming a predictor)
- Load the wordrecall data.
- Fit a simple linear regression model of prop on time.
- Display a scatterplot of the data and add the regression line.
- Display a residual plot with fitted (predicted) values on the horizontal axis.
- Display a normal probability plot of the residuals and add a diagonal line to the plot. The argument "datax" determines which way round to plot the axes (false by default, which plots the data on the vertical axis, or true, which plots the data on the horizontal axis).
- Load the
nortestpackage to access the Anderson-Darling normality test. - Create a log(time) variable and fit a simple linear regression model of prop on log(time).
- Repeat diagnostic plots and normality tests.
- Create a prop^-1.25 variable and fit a simple linear regression model of prop^-1.25 on time.
- Repeat diagnostic plots and normality tests.
- Use prop on log(time) model to find:
- 95% prediction interval for a prop at time 1000.
- 95% confidence interval for the expected change in prop for a 10-fold increase in time.
wordrecall <- read.table("~/path-to-folder/wordrecall.txt", header=T)
attach(wordrecall)

model.1 <- lm(prop ~ time)
summary(model.1)
#               Estimate Std. Error t value Pr(>|t|)
# (Intercept)  5.259e-01  4.881e-02  10.774 3.49e-07 ***
# time        -5.571e-05  1.457e-05  -3.825  0.00282 **
# Multiple R-squared:  0.5709,  Adjusted R-squared:  0.5318

plot(x=time, y=prop, ylim=c(-0.1, 0.9),
     panel.last = lines(sort(time), fitted(model.1)[order(time)]))

plot(x=fitted(model.1), y=residuals(model.1),
     panel.last = abline(h=0, lty=2))

qqnorm(residuals(model.1), main="", datax=TRUE)
qqline(residuals(model.1), datax=TRUE)

library(nortest)
ad.test(residuals(model.1)) # A = 0.262, p-value = 0.6426

lntime <- log(time)

model.2 <- lm(prop ~ lntime)
summary(model.2)
#              Estimate Std. Error t value Pr(>|t|)
# (Intercept)  0.846415   0.014195   59.63 3.65e-15 ***
# lntime      -0.079227   0.002416  -32.80 2.53e-12 ***
# ---
# Signif. codes:  0 ‘***’ 0.001 ‘**’ 0.01 ‘*’ 0.05 ‘.’ 0.1 ‘ ’ 1
#
# Residual standard error: 0.02339 on 11 degrees of freedom
# Multiple R-squared:  0.9899,  Adjusted R-squared:  0.989
# F-statistic:  1076 on 1 and 11 DF,  p-value: 2.525e-12

plot(x=lntime, y=prop,
     panel.last = lines(sort(lntime), fitted(model.2)[order(lntime)]))

plot(x=fitted(model.2), y=residuals(model.2),
     panel.last = abline(h=0, lty=2))

qqnorm(residuals(model.2), main="", datax=TRUE)
qqline(residuals(model.2), datax=TRUE)

ad.test(residuals(model.2)) # A = 0.3216, p-value = 0.4869

prop1.25 <- prop^-1.25

model.3 <- lm(prop1.25 ~ time)
summary(model.3)
#              Estimate Std. Error t value Pr(>|t|)
# (Intercept) 1.8693698  0.3869678   4.831 0.000527 ***
# time        0.0019708  0.0001155  17.067 2.91e-09 ***
# Multiple R-squared:  0.9636,  Adjusted R-squared:  0.9603

plot(x=time, y=prop1.25,
     panel.last = lines(sort(time), fitted(model.3)[order(time)]))

plot(x=fitted(model.3), y=residuals(model.3),
     panel.last = abline(h=0, lty=2))

qqnorm(residuals(model.3), main="", datax=TRUE)
qqline(residuals(model.3), datax=TRUE)

ad.test(residuals(model.3)) # A = 1.191, p-value = 0.002584

predict(model.2, interval="prediction",
        newdata=data.frame(lntime=log(1000)))
#         fit       lwr       upr
# 1 0.2991353 0.2449729 0.3532978

confint(model.2)[2,]*log(10) # 95% CI for 10-fold increase in time
#      2.5 %     97.5 %
# -0.1946689 -0.1701845

detach(wordrecall)
Mammal gestation (log-transforming the response)
- Load the mammgest data.
- Fit a simple linear regression model of Gestation on Birthwgt.
- Display a scatterplot of the data and add the regression line.
- Display residual plots with fitted (predicted) values on the horizontal axis.
- Display a normal probability plot of the residuals and add a diagonal line to the plot.
- Apply the Anderson-Darling normality test using the
nortestpackage. - Create a log(Gestation) variable and fit a simple linear regression model of log(Gestation) on Birthwgt.
- Repeat diagnostic plots and normality tests.
- Use log(Gestation) on Birthwgt model to find:
- 95% prediction interval for Gestation for a Birthwgt of 50.
- 95% confidence interval for proportional change in median Gestation for a 1-pound increase in Birthwgt.
- 95% confidence interval for proportional change in median Gestation for a 10-pound increase in Birthwgt.
mammgest <- read.table("~/path-to-folder/mammgest.txt", header=T)
attach(mammgest)

model.1 <- lm(Gestation ~ Birthwgt)
summary(model.1)
#             Estimate Std. Error t value Pr(>|t|)
# (Intercept) 187.0837    26.9426   6.944 6.73e-05 ***
# Birthwgt      3.5914     0.5247   6.844 7.52e-05 ***
# Multiple R-squared:  0.8388,  Adjusted R-squared:  0.8209

plot(x=Birthwgt, y=Gestation,
     panel.last = lines(sort(Birthwgt), fitted(model.1)[order(Birthwgt)]))

plot(x=fitted(model.1), y=residuals(model.1),
     panel.last = abline(h=0, lty=2))

qqnorm(residuals(model.1), main="", datax=TRUE)
qqline(residuals(model.1), datax=TRUE)

ad.test(residuals(model.1)) # A = 0.3116, p-value = 0.503

lnGest <- log(Gestation)

model.2 <- lm(lnGest ~ Birthwgt)
summary(model.2)
#             Estimate Std. Error t value Pr(>|t|)
# (Intercept) 5.278817   0.088177  59.866  5.1e-13 ***
# Birthwgt    0.010410   0.001717   6.062 0.000188 ***
# ---
# Signif. codes:  0 ‘***’ 0.001 ‘**’ 0.01 ‘*’ 0.05 ‘.’ 0.1 ‘ ’ 1
#
# Residual standard error: 0.2163 on 9 degrees of freedom
# Multiple R-squared:  0.8033,  Adjusted R-squared:  0.7814
# F-statistic: 36.75 on 1 and 9 DF,  p-value: 0.0001878

plot(x=Birthwgt, y=lnGest,
     panel.last = lines(sort(Birthwgt), fitted(model.2)[order(Birthwgt)]))

plot(x=fitted(model.2), y=residuals(model.2),
     panel.last = abline(h=0, lty=2))

qqnorm(residuals(model.2), main="", datax=TRUE)
qqline(residuals(model.2), datax=TRUE)

ad.test(residuals(model.2)) # A = 0.3135, p-value = 0.4963

exp(predict(model.2, interval="prediction",
            newdata=data.frame(Birthwgt=50)))
#        fit      lwr      upr
# 1 330.0781 197.3013 552.2092

# proportional change in median gestation for 1-unit increase in birthwgt
exp(coefficients(model.2)[2]) # 1.010465
exp(confint(model.2)[2,]) # 95% CI
#    2.5 %   97.5 %
# 1.006547 1.014398

# proportional change in median gestation for 10-unit increase in birthwgt
exp(10*coefficients(model.2)[2]) # 1.109714
exp(10*confint(model.2)[2,]) # 95% CI
#    2.5 %   97.5 %
# 1.067429 1.153674

detach(mammgest)
Shortleaf pine trees (log-transforming both response and predictor)
- Load the shortleaf data.
- Fit a simple linear regression model of Vol on Diam.
- Display a scatterplot of the data and add the regression line.
- Display residual plots with fitted (predicted) values on the horizontal axis.
- Display a normal probability plot of the residuals and add a diagonal line to the plot.
- Apply the Anderson-Darling normality test using the
nortestpackage. - Create a log(Diam) variable and fit a simple linear regression model of Vol on log(Diam).
- Repeat diagnostic plots and normality tests.
- Create a log(Vol) variable and fit a simple linear regression model of log(Vol) on log(Diam).
- Repeat diagnostic plots and normality tests.
- Use log(Vol) on log(Diam) model to find:
- 95% confidence interval for median Vol for a Diam of 10.
- 95% confidence interval for proportional change in median Vol for a 2-fold increase in Diam.
shortleaf <- read.table("~/path-to-folder/shortleaf.txt", header=T)
attach(shortleaf)

model.1 <- lm(Vol ~ Diam)
summary(model.1)
#             Estimate Std. Error t value Pr(>|t|)
# (Intercept) -41.5681     3.4269  -12.13   <2e-16 ***
# Diam          6.8367     0.2877   23.77   <2e-16 ***
# ---
# Multiple R-squared:  0.8926,  Adjusted R-squared:  0.891

plot(x=Diam, y=Vol,
     panel.last = lines(sort(Diam), fitted(model.1)[order(Diam)]))

plot(x=fitted(model.1), y=residuals(model.1),
     panel.last = abline(h=0, lty=2))

qqnorm(residuals(model.1), main="", datax=TRUE)
qqline(residuals(model.1), datax=TRUE)

ad.test(residuals(model.1)) # A = 0.9913, p-value = 0.01215

lnDiam <- log(Diam)

model.2 <- lm(Vol ~ lnDiam)
summary(model.2)
#             Estimate Std. Error t value Pr(>|t|)
# (Intercept) -116.162     10.830  -10.73 2.88e-16 ***
# lnDiam        64.536      4.562   14.15  < 2e-16 ***
# Multiple R-squared:  0.7464,  Adjusted R-squared:  0.7427

plot(x=lnDiam, y=Vol,
     panel.last = lines(sort(lnDiam), fitted(model.2)[order(lnDiam)]))

plot(x=fitted(model.2), y=residuals(model.2),
     panel.last = abline(h=0, lty=2))

qqnorm(residuals(model.2), main="", datax=TRUE)
qqline(residuals(model.2), datax=TRUE)

ad.test(residuals(model.2)) # A = 2.3845, p-value = 4.273e-06

lnVol <- log(Vol)

model.3 <- lm(lnVol ~ lnDiam)
summary(model.3)
#             Estimate Std. Error t value Pr(>|t|)
# (Intercept)  -2.8718     0.1216  -23.63   <2e-16 ***
# lnDiam        2.5644     0.0512   50.09   <2e-16 ***
# ---
# Signif. codes:  0 ‘***’ 0.001 ‘**’ 0.01 ‘*’ 0.05 ‘.’ 0.1 ‘ ’ 1
#
# Residual standard error: 0.1703 on 68 degrees of freedom
# Multiple R-squared:  0.9736,  Adjusted R-squared:  0.9732
# F-statistic:  2509 on 1 and 68 DF,  p-value: < 2.2e-16

plot(x=lnDiam, y=lnVol,
     panel.last = lines(sort(lnDiam), fitted(model.3)[order(lnDiam)]))

plot(x=fitted(model.3), y=residuals(model.3),
     panel.last = abline(h=0, lty=2))

qqnorm(residuals(model.3), main="", datax=TRUE)
qqline(residuals(model.3), datax=TRUE)

ad.test(residuals(model.3)) # A = 0.5309, p-value = 0.1692

exp(predict(model.3, interval="confidence",
            newdata=data.frame(lnDiam=log(10))))
#        fit      lwr      upr
# 1 20.75934 19.92952 21.62372

# proportional change in median Vol for 2-fold increase in Diam
2^(coefficients(model.3)[2]) # 5.915155
2^(confint(model.3)[2,]) # 95% CI
#    2.5 %   97.5 %
# 5.510776 6.349207

detach(shortleaf)
Underground air quality (interactions)
- Load the swallows data.
- Load the
carpackage to access 3D scatterplots. - Create interaction variables and fit a multiple linear regression model of Vent on O2 + CO2 + Type + TypeO2 + TypeCO2 + CO2O2.
- Use
anovafunction to display the ANOVA table with sequential (type I) sums of squares. - Calculate partial F-statistic and p-value.
- Display residual plots with fitted (predicted) values on the horizontal axis.
- Fit a multiple linear regression model of Vent on O2 + CO2 + Type.
- Display residual plots with fitted (predicted) values on the horizontal axis.
- Display a normal probability plot of the residuals and add a diagonal line to the plot.
- Apply the Anderson-Darling normality test using the
nortestpackage.
swallows <- read.table("~/path-to-folder/allswallows.txt", header=T)
attach(swallows)

library(car)
scatter3d(Vent ~ O2 + CO2, subset=Type==1) # adult
scatter3d(Vent ~ O2 + CO2, subset=Type==0) # nestling
scatter3d(Vent ~ O2 + CO2, subset=Type==0, revolutions=3, speed=0.5, grid=F)

TypeO2 <- Type*O2
TypeCO2 <- Type*CO2
CO2O2 <- CO2*O2

model.1 <- lm(Vent ~ O2 + CO2 + Type + TypeO2 + TypeCO2 + CO2O2)
summary(model.1)
#             Estimate Std. Error t value Pr(>|t|)
# (Intercept)  -18.399    160.007  -0.115   0.9086
# O2             1.189      9.854   0.121   0.9041
# CO2           54.281     25.987   2.089   0.0378 *
# Type         111.658    157.742   0.708   0.4797
# TypeO2        -7.008      9.560  -0.733   0.4642
# TypeCO2        2.311      7.126   0.324   0.7460
# CO2O2         -1.449      1.593  -0.909   0.3642
# ---
# Signif. codes:  0 ‘***’ 0.001 ‘**’ 0.01 ‘*’ 0.05 ‘.’ 0.1 ‘ ’ 1
#
# Residual standard error: 165.6 on 233 degrees of freedom
# Multiple R-squared:  0.272,  Adjusted R-squared:  0.2533
# F-statistic: 14.51 on 6 and 233 DF,  p-value: 4.642e-14

anova(model.1) # Sequential (type I) SS
#            Df  Sum Sq Mean Sq F value  Pr(>F)
# O2          1   93651   93651  3.4156 0.06585 .
# CO2         1 2247696 2247696 81.9762 < 2e-16 ***
# Type        1    5910    5910  0.2156 0.64288
# TypeO2      1   14735   14735  0.5374 0.46425
# TypeCO2     1    2884    2884  0.1052 0.74598
# CO2O2       1   22664   22664  0.8266 0.36421
# Residuals 233 6388603   27419
# ---
# Signif. codes:  0 ‘***’ 0.001 ‘**’ 0.01 ‘*’ 0.05 ‘.’ 0.1 ‘ ’ 1

((14735+2884+22664)/3)/27419 # F-stat = 0.4897212
pf(0.49, 3, 233, lower.tail=F) # p-value = 0.6895548

plot(x=fitted(model.1), y=residuals(model.1),
     panel.last = abline(h=0, lty=2))

model.2 <- lm(Vent ~ O2 + CO2 + Type)
summary(model.2)
#             Estimate Std. Error t value Pr(>|t|)
# (Intercept)  136.767     79.334   1.724    0.086 .
# O2            -8.834      4.765  -1.854    0.065 .
# CO2           32.258      3.551   9.084   <2e-16 ***
# Type           9.925     21.308   0.466    0.642
# ---
# Signif. codes:  0 ‘***’ 0.001 ‘**’ 0.01 ‘*’ 0.05 ‘.’ 0.1 ‘ ’ 1
#
# Residual standard error: 165 on 236 degrees of freedom
# Multiple R-squared:  0.2675,  Adjusted R-squared:  0.2581
# F-statistic: 28.72 on 3 and 236 DF,  p-value: 7.219e-16

plot(x=fitted(model.2), y=residuals(model.2),
     panel.last = abline(h=0, lty=2))

qqnorm(residuals(model.2), main="", datax=TRUE)
qqline(residuals(model.2), datax=TRUE)

ad.test(residuals(model.2)) # A = 0.3175, p-value = 0.5358

detach(swallows)
Bluegill fish (polynomial regression)
- Load the bluegills data.
- Display a scatterplot of the data.
- Create an age-squared variable and fit a multiple linear regression model of length on age + agesq.
- Add a quadratic regression line to the scatterplot.
- Find a 95% prediction interval for length for an age of 5.
bluegills <- read.table("~/path-to-folder/bluegills.txt", header=T)
attach(bluegills)

plot(x=age, y=length)

agesq <- age^2

model <- lm(length ~ age + agesq)
summary(model)
#             Estimate Std. Error t value Pr(>|t|)
# (Intercept)   13.622     11.016   1.237     0.22
# age           54.049      6.489   8.330 2.81e-12 ***
# agesq         -4.719      0.944  -4.999 3.67e-06 ***
# ---
# Signif. codes:  0 ‘***’ 0.001 ‘**’ 0.01 ‘*’ 0.05 ‘.’ 0.1 ‘ ’ 1
#
# Residual standard error: 10.91 on 75 degrees of freedom
# Multiple R-squared:  0.8011,  Adjusted R-squared:  0.7958
# F-statistic: 151.1 on 2 and 75 DF,  p-value: < 2.2e-16

newX <- seq(min(age), max(age), length=100)
newXsq <- newX**2

plot(x=age, y=length,
     panel.last = lines(newX,
                        predict(model,
                                newdata=data.frame(age=newX, agesq=newXsq))))

predict(model, interval="prediction",
        newdata=data.frame(age=5, agesq=25))
#        fit     lwr      upr
# 1 165.9023 143.487 188.3177

detach(bluegills)
Experiment yield (polynomial regression)
- Load the yield data.
- Fit a simple linear regression model of Yield on Temp.
- Display a scatterplot of the data and add the simple linear regression line.
- Create a Temp-squared variable and fit a multiple linear regression model of Yield on Temp + Tempsq.
- Display a scatterplot of the data and add a quadratic regression line to the scatterplot.
yield <- read.table("~/path-to-folder/yield.txt", header=T)
attach(yield)

model.1 <- lm(Yield ~ Temp)
summary(model.1)
#             Estimate Std. Error t value Pr(>|t|)
# (Intercept) 2.306306   0.469075   4.917 0.000282 ***
# Temp        0.006757   0.005873   1.151 0.270641
# ---
# Signif. codes:  0 ‘***’ 0.001 ‘**’ 0.01 ‘*’ 0.05 ‘.’ 0.1 ‘ ’ 1
#
# Residual standard error: 0.3913 on 13 degrees of freedom
# Multiple R-squared:  0.09242,  Adjusted R-squared:  0.0226
# F-statistic: 1.324 on 1 and 13 DF,  p-value: 0.2706

plot(x=Temp, y=Yield,
     panel.last = lines(sort(Temp), fitted(model.1)[order(Temp)]))

Tempsq <- Temp^2

model.2 <- lm(Yield ~ Temp + Tempsq)
summary(model.2)
#               Estimate Std. Error t value Pr(>|t|)
# (Intercept)  7.9604811  1.2589183   6.323 3.81e-05 ***
# Temp        -0.1537113  0.0349408  -4.399 0.000867 ***
# Tempsq       0.0010756  0.0002329   4.618 0.000592 ***
# ---
# Signif. codes:  0 ‘***’ 0.001 ‘**’ 0.01 ‘*’ 0.05 ‘.’ 0.1 ‘ ’ 1
#
# Residual standard error: 0.2444 on 12 degrees of freedom
# Multiple R-squared:  0.6732,  Adjusted R-squared:  0.6187
# F-statistic: 12.36 on 2 and 12 DF,  p-value: 0.001218

newX <- seq(min(Temp), max(Temp), length=100)
newXsq <- newX**2

plot(x=Temp, y=Yield,
     panel.last = lines(newX,
                        predict(model.2,
                                newdata=data.frame(Temp=newX, Tempsq=newXsq))))

detach(yield)
Chemical odor (polynomial regression)
- Load the odor data.
- Create squared variables and fit a multiple linear regression model of Odor on Temp + Ratio + Height + Tempsq + Ratiosq + Heightsq.
- Fit a multiple linear regression model of Odor on Temp + Ratio + Height + Tempsq + Ratiosq.
odor <- read.table("~/path-to-folder/odor.txt", header=T)
attach(odor)

Tempsq <- Temp^2
Ratiosq <- Ratio^2
Heightsq <- Height^2

model.1 <- lm(Odor ~ Temp + Ratio + Height + Tempsq + Ratiosq + Heightsq)
summary(model.1)
#             Estimate Std. Error t value Pr(>|t|)
# (Intercept)  -30.667     10.840  -2.829   0.0222 *
# Temp         -12.125      6.638  -1.827   0.1052
# Ratio        -17.000      6.638  -2.561   0.0336 *
# Height       -21.375      6.638  -3.220   0.0122 *
# Tempsq        32.083      9.771   3.284   0.0111 *
# Ratiosq       47.833      9.771   4.896   0.0012 **
# Heightsq       6.083      9.771   0.623   0.5509
# ---
# Signif. codes:  0 ‘***’ 0.001 ‘**’ 0.01 ‘*’ 0.05 ‘.’ 0.1 ‘ ’ 1
#
# Residual standard error: 18.77 on 8 degrees of freedom
# Multiple R-squared:  0.8683,  Adjusted R-squared:  0.7695
# F-statistic: 8.789 on 6 and 8 DF,  p-value: 0.003616

model.2 <- lm(Odor ~ Temp + Ratio + Height + Tempsq + Ratiosq)
summary(model.2)
#             Estimate Std. Error t value Pr(>|t|)
# (Intercept)  -26.923      8.707  -3.092 0.012884 *
# Temp         -12.125      6.408  -1.892 0.091024 .
# Ratio        -17.000      6.408  -2.653 0.026350 *
# Height       -21.375      6.408  -3.336 0.008720 **
# Tempsq        31.615      9.404   3.362 0.008366 **
# Ratiosq       47.365      9.404   5.036 0.000703 ***
# ---
# Signif. codes:  0 ‘***’ 0.001 ‘**’ 0.01 ‘*’ 0.05 ‘.’ 0.1 ‘ ’ 1
#
# Residual standard error: 18.12 on 9 degrees of freedom
# Multiple R-squared:  0.8619,  Adjusted R-squared:  0.7852
# F-statistic: 11.23 on 5 and 9 DF,  p-value: 0.001169

detach(odor)