Minitab® – Procedure
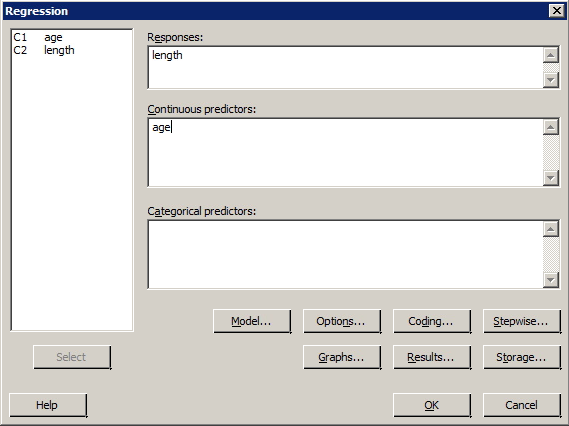
- Select Stat >> Regression >> Regression ... >> Fit Regression Model ...
- Specify the response and the predictor(s).
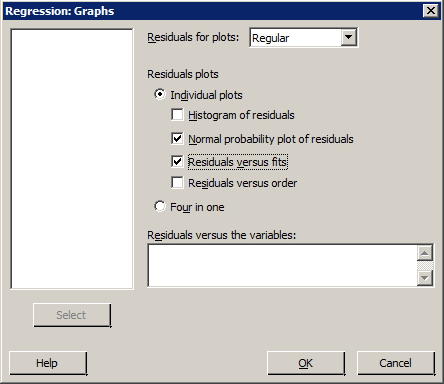
- Under Graphs...
- Under Residuals for Plots, select either Regular or Standardized.
- Under Residuals Plots, select the desired types of residual plots. If you want to create residuals vs. predictor plot, specify the predictor variable in the box labeled Residuals versus the variables.
- Select OK.
- Select OK. The standard regression output will appear in the session window, and the residual plots will appear in new windows.
Example
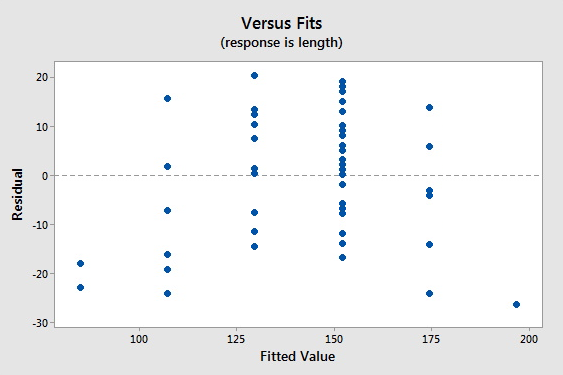
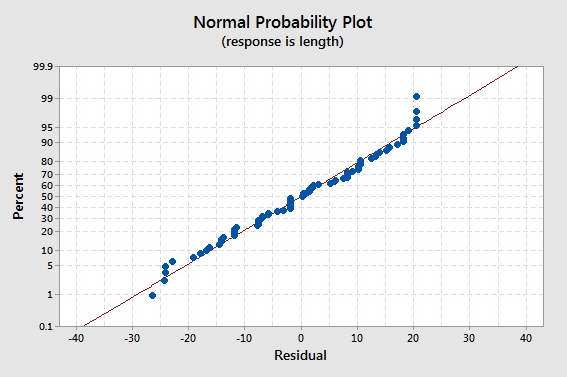
The data set bluegills.txt contains the lengths (in mm) and ages (in years) of n = 78 bluegill fish. Treating y = length as the response and x = age as the predictor, request a normal plot of the standardized residuals and a standardized residuals vs. fits plot.
Minitab dialog boxes


Sample output

