A symmetry model is important because testing symmetry is often the preliminary analysis on symmetric tables.
It is very restrictive because it has implications for both the association between the variables and the margins of the table.
The symmetry model rarely fits data very well. Example of a perfectly symmetric table:
|
1
|
2
|
3
|
Total
|
|
|
1
|
10
|
2
|
5
|
17
|
|
2
|
2
|
10
|
8
|
20
|
|
3
|
5
|
8
|
10
|
23
|
|
Total
|
17
|
20
|
23
|
Objective:
Fit the loglinear model of symmetry to test if a square table exhibits symmetry.
Assumptions:
The off diagonal cells have equal expected counts.
μij = μij for i ≠ j
= nii for i = jand row and column margins are equal, i.e., μi+ = μ+i
For our example, let S = classification by Siskel, and E = classification by Ebert.
Model structure:
log(μij) = λ + λi + λj + λij
where
λij = λji and λi = λj when i = j.
The second constraint indicates that the main/marginal effect terms are the same for the rows and columns; thus there are no superscripts.
Model fit:
Use G2, X2 as before. df = (# cells) - (# non-redundant parameters) = # off diagonal cells - # unique parameters = I(I - 1) - I(I - 1)/2 = I(I - 1)/2
G2 = 0.59, df = 3, p-value=0.90
The symmetry model seems to fit this data well. This also implies strong agreement. Recall that only strong agreement is not enough to indicate symmetry!
Parameter estimation and interpretation:
The MLE estimates are \(\hat{\mu}_{ij}=\hat{\mu}_{ji}=\dfrac{n_{ij}+n_{ji}}{2}\)
λ′s are interpreted as before.
There are many different ways to fit these models. I will only discuss one here that comes from Agresti.
You need to create a variable that takes on a unique value for each diagonal cell and a unique value of each pair of cells. For example,
\begin{align}
symm &=1 & i=j=1\\
&=2 & i=j=2\\
&=3 & i=j=3\\
&=4 & (i,j)=(1,2)=(2,1)\\
&=5 & (i,j)=(1,3)=(3,1)\\
&=6 & (i,j)=(2,3)=(3,2)\\
\end{align}
This new variable is treated as a nominal variable in fitting the model.
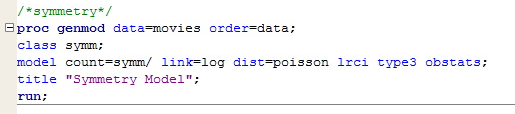
![]() See the first part of the movies.sas code for the creation of the variable "symm":
See the first part of the movies.sas code for the creation of the variable "symm":
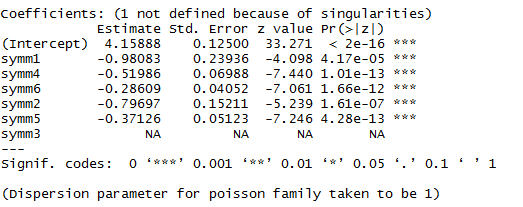
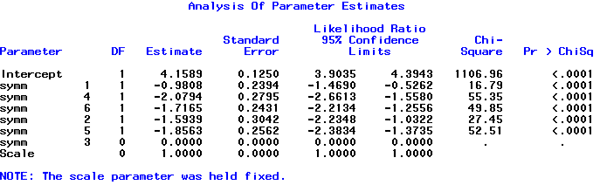
Part of the output:
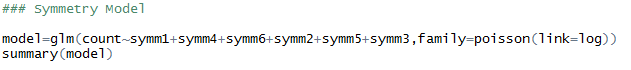
 See the second part of the movies.R code for the creation of variables "symm1", "symm2", "symm3", "symm4", "symm5" and "symm6". This is where we actually fit the symmetry model using this variable(s).
And, here is the output that we are interested in: