Lesson 9: Classification
Introduction
| Key Learning Goals for this Lesson: |
Textbook reading: Chapter 4: Classification and Section 2.2.3. |
Classification is supervised learning for which the true class labels for the data points are given in the training data.
Setup for supervised learning
- Training data: \({(x_1, g_1), (x_2, g_2), \cdots , (x_N, g_N )}\)
- The feature vector \(X = (X_1, X_2, \cdots , X_p)\), where each variable \(X_j\) is quantitative.
- The response variable G is categorical. \(G \in G = {1, 2, \cdots , K}\)
- Form a predictor \(G(x)\) to predict G based on X.
\(G(x)\) divides the input space (feature vector space) into a collection of regions, each labeled by one class. See the example partition of the feature vector space by \(G(x)\) in the following plots. For each plot, the space is divided into three pieces, each assigned with a particular class.
Classification Error Rate
The classification error rate is the number of observations that are misclassified over the sample size.
\begin{equation*}
\frac{1}{n} \sum_{i=1}^n I(\hat{Y_i} \neq y_i),
\end{equation*}
where $I(\hat{Y_i} \neq y_i) = 1$ if $\hat{Y_i} \neq y_i$ and 0 otherwise.
For binary classification, let 'Y.hat' be a 0-1 vector of the predicted class labels, and 'y' be a 0-1 vector of the observed class labels. We can calculate the classification error rate by "mean(abs(Y.hat-y))" in R.
Bayes Classification Rule
[Recall material from Section 2.2.3 in the textbook, specifically from the bottom half of page 37 through the top of page 39.]
Suppose the marginal distribution of G is specified by the probability mass function (pmf) \(p_G(g), g = 1, 2, \cdots , K\).
The conditional distribution of X given \(G = g\) is \( f_{X|G}(x | G = g)\).
The training data \((x_i,g_i),i=1, 2, \cdots ,N\), are independent samples from the joint distribution of X and G,
\[f_{X,G}(x, g) = p_G(g)f_{X|G}(x | G = g)\]
Assume the loss of predicting G at \(G(X)\) = \(\hat{G}\) is \(L(\hat{G}, G)\).
Goal of classification: to minimize the expected loss
\[E_{X,G}L(G(X), G) = E_X (E_{G|X}L(G(X), G))\]
To minimize the left hand side, it suffices to minimize \(E_{G|X}L(G(X), G)\) for each X. Hence the optimal predictor:
\(\hat{G}(x)= \text{arg} \underset{g}{min}E_{G|X=x}L(g, G)\)
The above decision rule is called the Bayes classification rule.
For 0-1 loss, i.e.,
\(L(g, g')= \begin{cases}
1 & g \ne g' \\
0 & g = g'
\end{cases}\)
\(E_{G|X=x}L(g, G)=1-Pr(G=g|X=x)\).
The Bayes rule becomes the rule of maximum posterior probability:
\( \begin {align} \hat{G}(x) &=\text{arg }\underset{g}{min} E_{G|X=x}L(g, G)\\
& = \text{arg }\underset{g}{max} Pr(G=g|X=x)\\
\end {align} \).
Many classification algorithms attempt to estimate \(Pr(G = g | X = x)\), then apply the Bayes rule.
Linear Methods for Classification
Decision boundaries are linear.
Two class problem:
- The decision boundary between the two classes is a hyperplane in the feature vector space.
- A hyperplane in the p dimensional input space is the set:
\[\{x:\alpha_o + \sum^{p}_{j=1}\alpha_{j}x_{j}=0\}\]
The two regions separated by a hyperplane:
\[\{x:\alpha_o + \sum^{p}_{j=1}\alpha_{j}x_{j} > 0\}\] and \[\{x:\alpha_o + \sum^{p}_{j=1}\alpha_{j}x_{j}<0\}\]
More than two classes:
- The decision boundary between any pair of classes k and l is a hyperplane (shown in previous figure).
![]() How do you choose the hyperplane?
How do you choose the hyperplane?
Example methods for deciding the hyperplane:
- Linear discriminant analysis.
- Logistic regression.
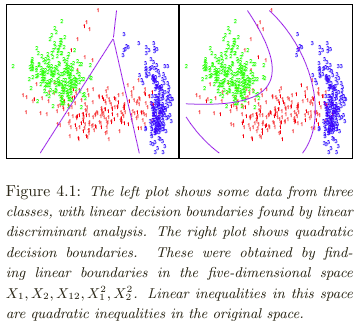
Linear decision boundaries are not necessarily constrained. We can expand the feature space by adding in extra variables formed by functions of the original variables. Linear decision boundaries in the expanded feature space may be nonlinear in the original feature space.

