Lesson 11: Tree-based Methods
Introduction
| Key Learning Goals for this Lesson: |
Textbook reading: Chapter 8: Tree-Based Methods. |
Decision trees can be used for both regression and classification problems. Here we focus on classification trees. Classification trees are a very different approach to classification than prototype methods such as k-nearest neighbors. The basic idea of these methods is to partition the space and identify some representative centroids.
They also differ from linear methods, e.g., linear discriminant analysis, quadratic discriminant analysis and logistic regression. These methods use hyperplanes as classification boundaries.
Classification trees are a hierarchical way of partitioning the space. We start with the entire space and recursively divide it into smaller regions. At the end, every region is assigned with a class label.
Tree Structured Classifier
The following textbook presents Classification and Regression Trees (CART) :
Reference: Classification and Regression Trees by L. Breiman, J. H. Friedman, R. A. Olshen, and C. J. Stone, Chapman & Hall, 1984.
Let's start with a medical example to get a rough idea about classification trees.
A Medical Example
One big advantage for decision trees is that the classifier generated is highly interpretable. For physicians, this is an especially desirable feature.
In this example patients are classified into one of two classes: high risk versus low risk. It is predicted that the high risk patients would not survive at least 30 days based on the initial 24-hour data. There are 19 measurements taken from each patient during the first 24 hours. These include blood pressure, age, etc.
Here a tree structured classification rule is generated and can be interpreted as follows:
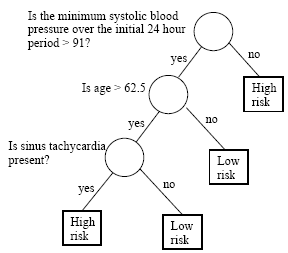
First we look at the minimum systolic blood pressure within the initial 24 hours and determine whether it is above 91. If the answer is no, the patient is classified as high-risk. We don't need to look at the other measurements for this patient. If the answer is yes, then we can't make a decision yet. The classifier will then look at whether the patient's age is greater than 62.5 years old. If the answer is no, the patient is classified as low risk. However, if the patient is over 62.5 years old, we still cannot make a decision and then look at the third measurement, specifically, whether sinus tachycardia is present. If the answer is no, the patient is classified as low risk. If the answer is yes, the patient is classified as high risk.
Only three measurements are looked at by this classifier. For some patients, only one measurement determines the final result. Classification trees operate similarly to a doctor's examination.

