Lesson 1 (b): Exploratory Data Analysis (EDA)
Introduction
| Key Learning Goals for this Lesson: |
Textbook reading: Consult Course Schedule |
Exploratory Data Analysis (EDA) may also be described as data-driven hypothesis generation. Given a complex set of observations, often EDA provides the initial pointers towards various learning techniques. The data is examined for structures that may indicate deeper relationships among cases or variables.
In this lesson, we will focus on both aspects of EDA:
- Numerical summarization
- Data visualization.
This course is based on R software. There are several attractive features of R that make it a software of choice both in academia as well as in industry.
- R is an open-source software and is free to download.
- R is supported by 3,000+ packages to deal with large volumes of data in a wide variety of applications. For instance, the svd() function performs the singular value decomposition in a single line of coding, which cannot be so easily implemented in C, Java or Python.
- R is quite versatile. After an algorithm is developed in R, the program may be sped up by transforming the R codes to other languages.
- R is a mainstream analytical tool.
Reference:
- The Popularity of Data Analysis Software by R.A. Muenchen,
- R You Ready for R? by Ashlee Vance
- R Programming for Data Science by Roger Peng
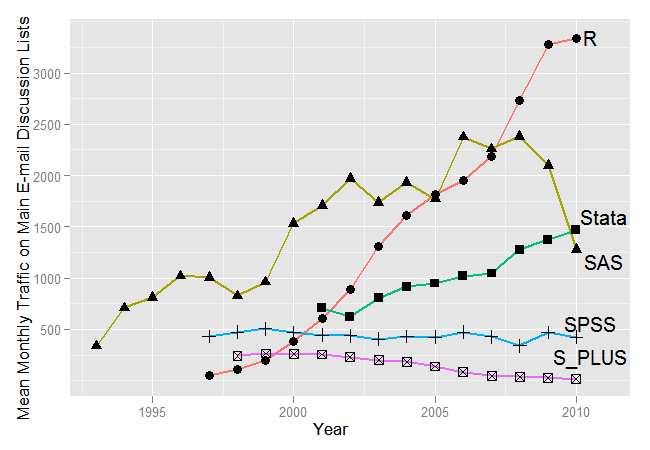
The following diagram shows that in recent times R is gaining popularity as monthly programming discussion traffic shows explosive growth of discussions regarding R.
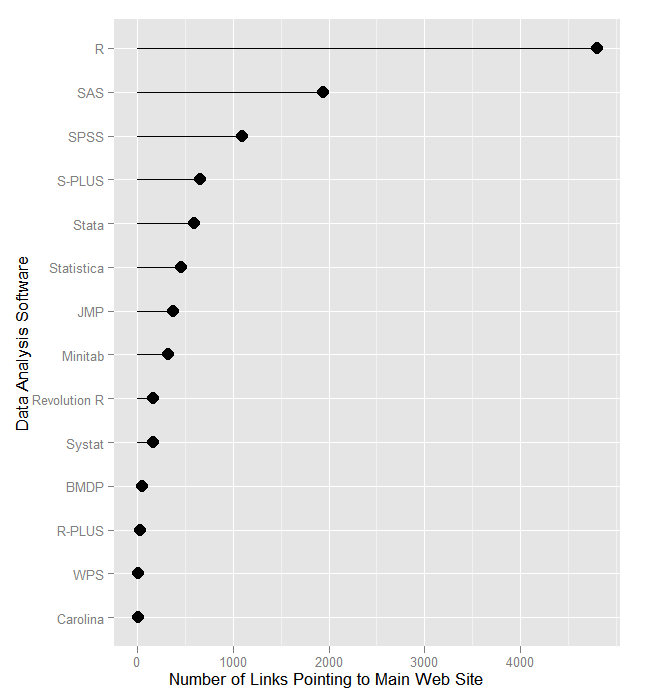
R has a vibrant user community. As a result of that R has the most web site links that point to it.
R can be installed from the CRAN website https://www.r-project.org/ following the instructions. Downloading R-Studio is strongly recommended. To develop familiarity with R it is suggested to follow through the material in Introduction to R. For further information refer to the Course Syllabus. Other useful websites on R are https://stackoverflow.com/questions/tagged/r and https://rseek.org/.
One of the objectives of this course is to strengthen the basics in R. The R-Labs given in the textbook are followed closely. Along with the material in the text, two other features in R are introduced.
- R Markdown: This allows the users to knit the R codes and outputs directly into the document.
- R library(ggplot2): A very useful and sophisticated set of plotting functions to produce high quality graphs

