3.7 - Decomposing The Error When There Are Replicates
To conclude this lesson we'll digress slightly to consider the lack of fit test for linearity —the "L" in the "LINE" conditions. The reason we consider this here is that, like the ANOVA test of earlier, this test is an F-test based on decomposing sums of squares.
However, before we "derive" the lack of fit F-test, it is important to note that the test requires repeat observations — called "replicates" — for at least one of the values of the predictor x. That is, if each x value in the data set is unique, then the lack of fit test can't be conducted on the data set. Even when we do have replicates, we typically need quite a few for the test to have any power. As such, this test generally only applies to specific types of dataset with plenty of replicates.
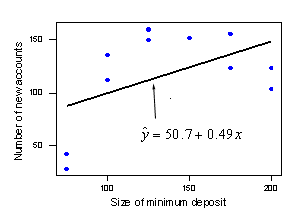
As is often the case before we learn a new hypothesis test, we have to get some new notation under our belt. In doing so, we'll look at some (contrived) data that purports to describe the relationship between the size of the minimum deposit required when opening a new checking account at a bank (x) and the number of new accounts at the bank (y) (newaccounts.txt). Suppose the trend in the data looks curved, but we fit a line through the data nonetheless:
If you roll your cursor over each of the specific x values (75, 100, 125, 150, 175, and 200) on the x-axis, you will see the standard notation used for the lack of fit F-test. Let's take the case where x = 75 dollars:
- \(y_{11}\) denotes the first measurement (28) made at the first x-value (x = 75) in the data set.
- \(y_{12}\) denotes the second measurement (42) made at the first x-value (x = 75) in the data set.
- \(\bar{y}_{1}\) denotes the average (35) of all of the y values at the first x-value (x = 75).
- \(\hat{y}_{11}\) denotes the predicted response (87.5) for the first measurement made at the first x-value (x = 75).
- \(\hat{y}_{12}\) denotes the predicted response (87.5) for the second measurement made at the first x-value (x = 75).
You should now understand the notation that appears when you roll your cursor over the other x values (100, 125, and so on). In general:
- \(y_{ij}\) denotes the jth measurement made at the ith x-value in the data set.
- \(\bar{y}_{i}\) denotes the average of all of the y values at the ith x-value.
- \(\hat{y}_{ij}\) denotes the predicted response for the jth measurement made at the ith x-value.
If you think about it, there are two different explanations for why our data points might not fall right on the estimated regression line. One possibility is that our regression model doesn't describe the trend in the data well enough. That is, the model may exhibit "lack of fit." The second possibility is that, as is often the case, there is just random variation in the data. This realization suggests that we should decompose the error into two components — one part due to lack of fit of the model and the second part just due to random error. If most of the error is due to lack of fit, and not just random error, it suggests that we should scrap our model and try a different one.
An example
Let's try decomposing the error in the checking account example, (newaccounts.txt) . Recall that the prediction error for any data point is the distance of the observed response from the predicted response, i.e., \(y_{ij}-\hat{y}_{ij}\). (Can you identify these distances on the plot of the data below?) To quantify the total error of prediction, we determine this distance for each data point, square the distance, and add up all of the distances to get:
\[\sum_{i}\sum_{j}(y_{ij}-\hat{y}_{ij})^2\]
Not surprisingly, this quantity is called the "error sum of squares" and is denoted SSE. The error sum of squares for our checking account example is \(\sum_{i}\sum_{j}(y_{ij}-\hat{y}_{ij})^2=14742\).
If a line fits the data well, then the average of the observed responses at each x-value should be close to the predicted response for that x-value. Therefore, to determine how much of the total error is due to lack of model fit, we determine how far the average observed response at each x-value is from the predicted response of each data point. That is, we calculate the distance \(\bar{y}_{i}-\hat{y}_{ij}\). To quantify the total lack of fit, we determine this distance for each data point, square the distance, and add up all of the distances to get:
\[\sum_{i}\sum_{j}(\bar{y}_{i}-\hat{y}_{ij})^2\]
Not surprisingly, this quantity is called the "lack of fit sum of squares" and is denoted SSLF. The lack of fit sum of squares for our checking account example is \(\sum_{i}\sum_{j}(\bar{y}_{i}-\hat{y}_{ij})^2=13594\).
To determine how much of the total error is due to just random error, we determine how far each observed response is from the average observed response at each x-value. That is, we calculate the distance \(y_{ij}-\bar{y}_{i}\). To quantify the total pure error, we determine this distance for each data point, square the distance, and add up all of the distances to get:
\[\sum_{i}\sum_{j}(y_{ij}-\bar{y}_{i})^2\]
Not surprisingly, this quantity is called the "pure error sum of squares" and is denoted SSPE. The pure error sum of squares for our checking account example is \(\sum_{i}\sum_{j}(y_{ij}-\bar{y}_{i})^2=1148\).
 |
\(\sum_{i}\sum_{j}(y_{ij}-\hat{y}_{ij})^2=14742\) \(\sum_{i}\sum_{j}(\bar{y}_{i}-\hat{y}_{ij})^2=13594\) \(\sum_{i}\sum_{j}(y_{ij}-\bar{y}_{i})^2=1148\) |
In summary, we've shown in this checking account example that most of the error (SSE = 14742) is attributed to the lack of a linear fit (SSLF = 13594) and not just to random error (SSPE = 1148).
Another example
Let's see how our decomposition of the error works with a different example — one in which a line fits the data well. Suppose the relationship between the size of the minimum deposit required when opening a new checking account at a bank (x) and the number of new accounts at the bank (y) instead looks like this:
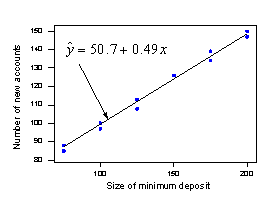 |
\(\sum_{i}\sum_{j}(y_{ij}-\hat{y}_{ij})^2=45.1\) \(\sum_{i}\sum_{j}(\bar{y}_{i}-\hat{y}_{ij})^2=6.6\) \(\sum_{i}\sum_{j}(y_{ij}-\bar{y}_{i})^2=38.5\) |
In this case, as we would expect based on the plot, very little of the total error (SSE = 45.1) is due to lack of a linear fit (SSLF = 6.6). Most of the error appears to be due to just random variation in the number of checking accounts (SSPE = 38.5).
In summary
The basic idea behind decomposing the total error is:
- We break down the residual error ("error sum of squares" — denoted SSE) into two components:
- a component that is due to lack of model fit ("lack of fit sum of squares" — denoted SSLF)
- a component that is due to pure random error ("pure error sum of squares" — denoted SSPE)
- If the lack of fit sum of squares is a large component of the residual error, it suggests that a linear function is inadequate.
Here is a simple picture illustrating how the distance \(y_{ij}-\hat{y}_{ij}\) is decomposed into the sum of two distances \(\bar{y}_{i}-\hat{y}_{ij}\) and \(y_{ij}-\bar{y}_{i}\). Roll your cursor over each of the three components of the equation at the bottom of the plot to see what each of the values represents geometrically.
Although the derivation isn't as simple as it seems, the decomposition holds for the sum of the squared distances as well:
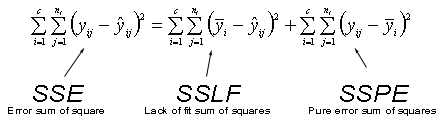
SSE = SSLF + SSPE
The degrees of freedom associated with each of these sums of squares follow a similar decomposition.
- As before, the degrees of freedom associated with SSE is n-2. (The 2 comes from the fact that you estimate 2 parameters — the slope and the intercept — whenever you fit a line to a set of data.)
- The degrees of freedom associated with SSLF is c-2, where c denotes the number of distinct x values you have.
- The degrees of freedom associated with SSPE is n-c, where again c denotes the number of distinct x values you have.
You might notice that the degrees of freedom breakdown as:
|
(n - 2)
|
=
|
(c - 2)
|
+
|
(n - c)
|
|
degrees of freedom associated with SSE
|
degrees of freedom associated with SSLF
|
degrees of freedom associated with SSPE
|
where again c denotes the number of distinct x values you have.

