4.7 - Assessing Linearity by Visual Inspection
The first simple linear regression model condition concerns linearity: the mean of the response at each predictor value should be a linear function of the predictor. The neat thing about simple linear regression — in which there is a response y and just one predictor x — is that we can get a good feel for this condition just by looking at a simple scatter plot (so in this case we don't even need to look at a residual plot). Let's start by looking at three different examples.
Skin Cancer and Mortality
Do the data suggest that a linear function is adequate in describing the relationship between skin cancer mortality and latitude (skincancer.txt)?
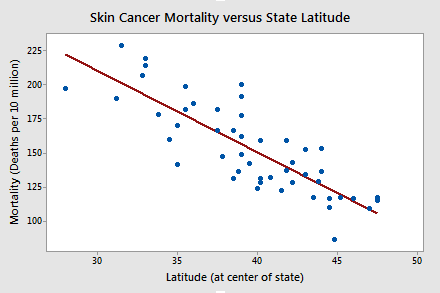
The answer is yes! It appears as if the relationship between latitude and skin cancer mortality is indeed linear, and therefore it would be best if we summarized the trend in the data using a linear function.
Alligators
The length of an alligator can be estimated fairly accurately from aerial photographs or from a boat. Estimating the weight of the alligator, however, is a much greater challenge. One approach is to use a regression model that summarizes the trend between the length and weight of alligators. The length of an alligator obtained from an aerial photograph or boat can then be used to predict the weight of the alligator. In taking this approach, some wildlife biologists captured a random sample of n = 25 alligators. They measured the length (x, in inches) and weight (y, in pounds) of each alligator. (alligator.txt)
Do the resulting data suggest that a linear function is adequate in describing the relationship between the length and weight of an alligator?
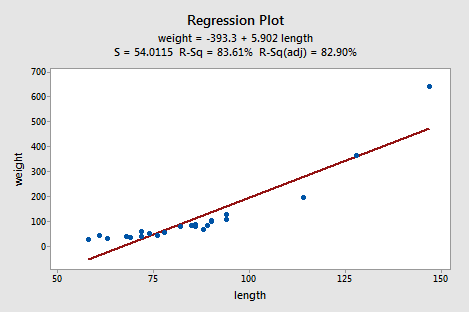
The answer is no! Don't you think a curved function would more adequately describe the trend? The scatter plot gives us a pretty good indication that a linear model is inadequate in this case.
Alloy Corrosion
Thirteen (n = 13) alloy specimens comprised of 90% copper and 10% nickel — each with a specific iron content — were tested for corrosion. Each specimen was rotated in salty seawater at 30 feet per second for 60 days. The corrosion was measured in weight loss in milligrams/square decimeter/day. The researchers were interested in studying the relationship between iron content (x) and weight loss due to corrosion (y). (corrosion.txt)
Do the resulting data that appear in the following plot suggest that a linear function is adequate in describing the relationship between iron content and weight loss due to corrosion?
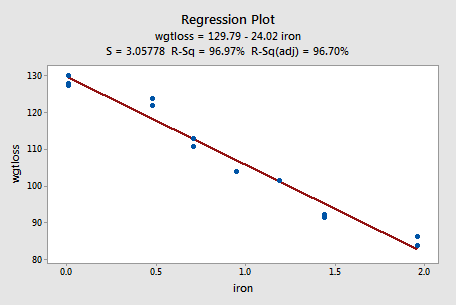
The answer is yes! As in the first example, our visual inspection of the data suggests that a linear model would be adequate in describing the trend between iron content and weight loss due to corrosion.

