5.2 - Example on Underground Air Quality
What are the breathing habits of baby birds that live in underground burrows?
 Some mammals burrow into the ground to live. Scientists have found that the quality of the air in these burrows is not as good as the air above ground. In fact, some mammals change the way that they breathe in order to accommodate living in the poor air quality conditions underground.
Some researchers (Colby, et al, 1987) wanted to find out if nestling bank swallows, which live in underground burrows, also alter how they breathe. The researchers conducted a randomized experiment on n = 120 nestling bank swallows. In an underground burrow, they varied the percentage of oxygen at four different levels (13%, 15%, 17%, and 19%) and the percentage of carbon dioxide at five different levels (0%, 3%, 4.5%, 6%, and 9%). Under each of the resulting 5 × 4 = 20 experimental conditions, the researchers observed the total volume of air breathed per minute for each of 6 nestling bank swallows. In this way, they obtained the following data (babybirds.txt) on the n = 120 nestling bank swallows:
- Response (y): percentage increase in "minute ventilation," (Vent), i.e., total volume of air breathed per minute.
- Potential predictor (x1): percentage of oxygen (O2) in the air the baby birds breathe.
- Potential predictor (x2): percentage of carbon dioxide (CO2) in the air the baby birds breathe.
Here's a scatter plot matrix of the resulting data obtained by the researchers:
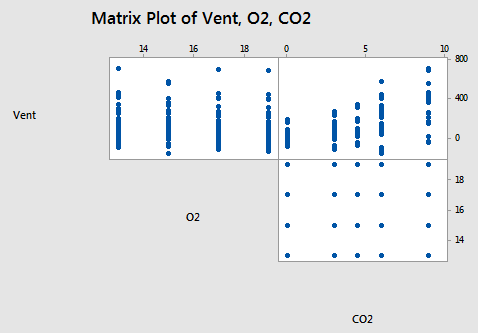
What does this particular scatter plot matrix tell us? Do you buy into the following statements?
- There doesn't appear to be a substantial relationship between minute ventilation (Vent) and percentage of oxygen (O2).
- The relationship between minute ventilation (Vent) and percentage of carbon dioxide (CO2) appears to be curved and with increasing error variance.
- The plot between percentage of oxygen (O2) and percentage of carbon dioxide (CO2) is the classical appearance of a scatter plot for the experimental conditions. The plot suggests that there is no correlation at all between the two variables. You should be able to observe from the plot the 4 levels of O2 and the 5 levels of CO2 that make up the 5×4 = 20 experimental conditions.
When we have one response variable and only two predictor variables, we have another sometimes useful plot at our disposal, namely a "three-dimensional scatter plot:"
If we added the estimated regression equation to the plot, what one word do you think describes what it would look like? Click the "Draw Plane" button in the above animation to draw the plot of the estimated regression equation for this data. Does it make sense that it looks like a "plane?" Incidentally, it is still important to remember that the plane depicted in the plot is just an estimate of the actual plane in the population that we are trying to study.
Here is a reasonable "first-order" model with two quantitative predictors that we could consider when trying to summarize the trend in the data:
\[y_i=(\beta_0+\beta_1x_{i1}+\beta_2x_{i2})+\epsilon_i\]
where:
- yi is percentage of minute ventilation of nestling bank swallow i
- xi1 is percentage of oxygen exposed to nestling bank swallow i
- xi2 is percentage of carbon dioxide exposed to nestling bank swallow i
and the independent error terms εi follow a normal distribution with mean 0 and equal variance σ2.
The adjective "first-order" is used to characterize a model in which the highest power on all of the predictor terms is one. In this case, the power on xi1, although typically not shown, is one. And, the power on xi2 is also one, although not shown. Therefore, the model we formulated can be classified as a "first-order model." An example of a second-order model would be \(y=\beta_0+\beta_1x+\beta_2x^2+\epsilon\).
Do you have your research questions ready? How about the following set of questions? (Do the procedures that appear in parentheses seem appropriate in answering the research question?)
- Is oxygen related to minute ventilation, after taking into account carbon dioxide? (Conduct a hypothesis test for testing whether the O2 slope parameter is 0.)
- Is carbon dioxide related to minute ventilation, after taking into account oxygen? (Conduct a hypothesis test for testing whether the CO2 slope parameter is 0.)
- What is the mean minute ventilation of all nestling bank swallows whose breathing air is comprised of 15% oxygen and 5% carbon dioxide? (Calculate and interpret a confidence interval for the mean response.)
Here's statistical software output for the multiple regression model we formulated above:
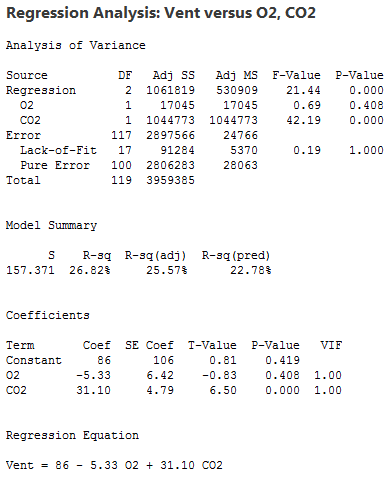
What do we learn from the output?
- Only 26.82% of the variation in minute ventilation is reduced by taking into account the percentages of oxygen and carbon dioxide.
- The P-values for the t-tests appearing in the table of estimates suggest that the slope parameter for carbon dioxide level (P < 0.001) is significantly different from 0, while the slope parameter for oxygen level (P = 0.408) is not. Does this conclusion appear consistent with the above scatter plot matrix and the three-dimensional plot? Yes!
- The P-value for the analysis of variance F-test (P < 0.001) suggests that the model containing oxygen and carbon dioxide levels is more useful in predicting minute ventilation than not taking into account the two predictors. (Again, the F-test does not tell us that the model with the two predictors is the best model! For one thing, we have performed no model checking yet!)

