About this course
Welcome to the course notes for STAT 501: Regression Methods. These notes are designed and developed by Penn State’s Department of Statistics and offered as open educational resources. These notes are free to use under Creative Commons license CC BY-NC 4.0.
This course is part of the Online Master of Applied Statistics program offered by Penn State’s World Campus.
Currently enrolled?
If you are a current student in this course, please see Canvas for your syllabus, assignments, lesson videos, and communication from your instructor.
Course Overview
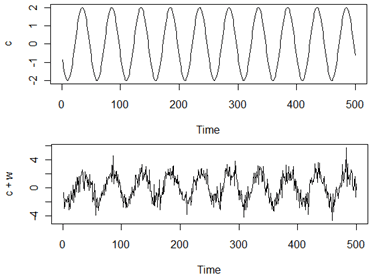 The objective of this course is to learn and apply statistical methods for the analysis of data that have been observed over time. Our challenge in this course is to account for the correlation between measurements that are close in time. Topics covered in this course include methods for:
- Modeling univariate time series data with Autoregressive and Moving Average Models (denoted as ARIMA models, sometimes called Box Jenkins models).
- Tools for model identification, model estimation, and assessment of the suitability of the model.
- Using a model for forecasting and determining prediction intervals for forecasts.
- Smoothing methods and trend/seasonal decomposition methods. Smoothing methods include moving averages, exponential smoothing, and Lowess smoothers.
- Relationships between time series variables, cross correlation, lagged regression models
- Intervention Analysis (basically before/after analysis of a time series to assess effect of a new policy, treatment, etc.)
- Longitudinal Analysis and Repeated Measures Models for comparing treatments when the response is a time series.
- Vector Autoregressive Models for Multivariate Time Series
- ARCH Models for changing variation and periods of volatility in a series
- Analyzing the frequency domain - Periodograms, Spectral Density, Identifying the important periodic components of a series.
We will need to use a statistical software program to analyze time series data. The course assignments and notes include R code to analyze our data. If you are unfamiliar with R (or need to brush up), please take some time to follow through the following introduction: STAT Online: Introduction to R
Contributors
This is the STAT 510 online course materials website. There are lots of examples, notes, and lecture materials on this website. You may want to make a bookmark for this site in your browser.
Featured on this site are the online notes created and maintained by Dr. Megan Romer.

