Lesson 11: Gene Set Analysis
| Key Learning Goals for this Lesson: |
|
Introduction
High throughput results often lead to a long list of “significant” features. This list might be derived from a gene expression study or by looking at protein binding sites, genetic variations, sequence analysis etc.
Gene set enrichment analysis is a method for validating and interpreting the list by matching its elements to reference sets that are relevant to the problem. For example, if you're looking at a gene list from a study of depression, it would be really exciting if many of the significant features were associated with neurotransmitters. Alternatively, it would be interesting to know if features associated with neurotransmitters differed significantly between depressed and normal individuals. Unfortunately, usually the story is not that clear, and gene set analysis is only one of the many clues we use.
If we have only a few features on the list, we could do a literature search to determine what is already known about each feature. Of, if we have the laboratory resources, we could perform functional studies using knockout strains, silencing mechanisms, upregulating mechanisms, etc. Unfortunately, even with 10 genes is very expensive to do functional studies.
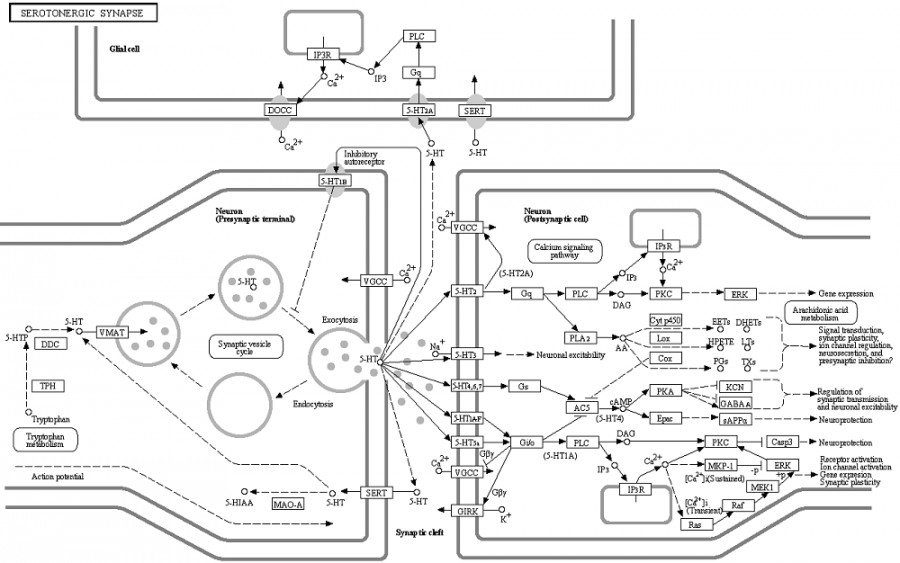
When we have larger lists, one approach is to leverage information already available in large web-based databases. For example, if we are doing a study of gene expression associated with depression, we might look at biological pathways diagrams for the known neurotransmitters serotonin, norepinephrine and dopamine. A biological pathway diagram might show a network of proteins that regulate each of these transmitters, or a gene regulatory network involved in the manufacture or activation of these transmitters in the brain. These diagrams are often constructed by painstaking "manual curation" from experimental work combined with literature search. In any case, pathways databases such as KEGG provide a repository of diagrams along with important information such as the names of the features in the diagram. For example a pathway for serotonin is:
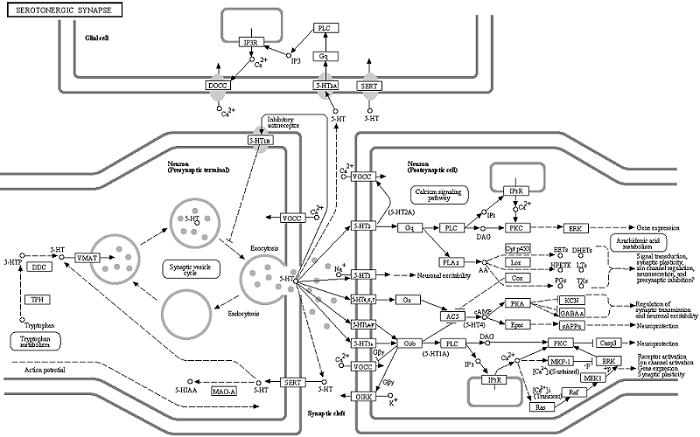
[ ENLARGE ] - [ Original Image ] Image used with permission of KEGG.
Gene set enrichment analysis works by creating a 2-way table of counts, where the "universe" of features is the set from which our list was selected. For example, if we selected all the differentially expressed genes from a microarray experiment, our universe would be all the genes which are printed on the microarray. For an RNA-seq experiment, it might be all the genes detected in the samples. If we compile the list from a literature search, it might be all known genes in the organism. The reference set would be all the features in our universe that are in the pathway.
| features in the diagram | features not in the diagram | |
| features in the list | ||
| features not in the list |
We then do Fisher's exact test or the chi-squared test to determine if the number of features both on the list and in the diagram are what would be expected if we selected features at random from the universe, or if there is significant association between the list and the diagram. Often we are interested in both over-representation and under-representation. We might also do this test separately for up- and down-regulated genes.
Another question we might ask is, "Do the features in the reference set behave differently from those not in it?" For example, we might take the features in our reference set that are also in the feature universe as one population and the features not in the reference as another population. We could then do a t-test to determine if the mean fold changes are the same in both populations. [1] Another idea is to test if the distribution of fold changes is the same in both populations.[2]
Often we have numerous diagrams or other sets of features to which we will match our list, so we need to consider multiple testing adjustments.
References
[1] Bussemaker, Harmen J., Lucas D. Ward, and Andre Boorsma. "Dissecting complex transcriptional responses using pathway-level scores based on prior information." BMC bioinformatics 8.Suppl 6 (2007): S6.
[2] Subramanian, Aravind, et al. "Gene set enrichment analysis: a knowledge-based approach for interpreting genome-wide expression profiles." Proceedings of the National Academy of Sciences of the United States of America 102.43 (2005): 15545-15550.

