11.2 - Example: Primate Brain Data
The example of gene set analysis uses the primate brain data from Homework 5. We also use these data in a computing lab to illustrate clustering and gene set analysis.
Recall that the data are 3 biological replicates of human and chimpanzee brain. We used 4 distinct regions of each brain. The mRNA was hybridized to a human Affymetrix gene expression microarray, and differential expression analysis was performed using LIMMA. The gene list is the set of 200 genes with the smallest p-value from the overall F-test that all means are equal.
Gene Set Analysis with GO
In principle, our "universe" of gene would be all genes in the human genome. However, not all genes have probes on the microarray, and of the probes on the microarray, not all have an annotation in the GO database. Therefore the universe has to be reduced to genes represented by probes on the microarray which have a GO annotation. As well, not all of the 200 genes selected for our gene list have a GO annotation. The gene list also has to be reduced to a usable set. This reduced the gene universe to 7865 genes and the gene list to 160 genes.
We ran the GOStat package in Bioconductor on this gene list, using the Biological Process ontology for the human genome. We considered only nodes that are enriched for our gene list (i.e. that have more genes than expected from our gene list). We arbitrarily decided on p<0.001 as the cut-off for statistical significance, as the package does not have a formal method for multiple testing adjustment. Using the conditional test, this produced 47 significant nodes. Many of the annotations on this list refer to neural function or growth of neural cells. Here are the first few entries on this list of significant nodes:
##       GOBPID       Pvalue OddsRatio  ExpCount Count Size Term
## 1 GO:0007268 2.899098e-10  4.163969 10.222222    34  500  synaptic transmission
## 2 GO:0007399 9.917320e-10  2.945622 26.496000    58 1296  nervous system development
## 3 GO:0007420 8.058485e-09  4.027778  8.750222    29  428  brain development
## 4 GO:0007417 1.671928e-08  3.552083 11.346667    33  555  central nervous system development
## 5 GO:0007267 3.012535e-08  3.134041 15.394667    39  753  cell-cell signaling
## 6 GO:0050877 1.462947e-07  3.472552  9.976889    29  488  neurological system process
Notice that each of these GO nodes have 2 or 3 times as many genes from our set of 160 as would be expected by chance
If you are working with an organism that does not have a GO database, it is necessary to map genes between your organism and a reference organism that has a GO ontology. Due to genome evolution, the mapping may not be one-to-one - for example the species you are working with might have some gene duplications since divergence from the common ancestor of the reference species. The current versions of the software do not allow duplicates on the gene list or the gene universe. GOStats removes any duplicates on the gene list and in the gene universe to a single copy.
Testing Expression Differences
Another idea for gene set analysis starts from the genes in the reference set, and seeing if they express differently from genes not in the reference set. It is not clear if the overall expression intensity should be used, or whether gene expression should be reduced to a z-score for each gene.
In the GO analysis, the GO node with the smallest p-value was
GOID: GO:0007268
Term:synaptic transmission
Ontology: BP
Definition: The process of communication from a neuron to a target (neuron, muscle, or secretory cell) across a synapse.
Synonym: neurotransmission
Synonym: regulation of synapse
Synonym: signal transmission across a synapse
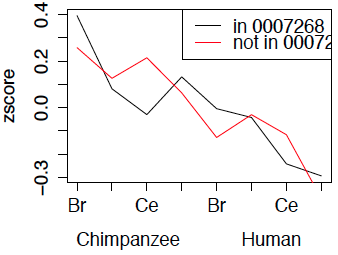
The coef component of the LIMMA output has the mean expression of each gene in each treatment. These were centred and scaled to form z-scores. We then took the mean z-score for the genes in and not in node GO:0007268. The plot below summarizes the results.
Note that the differences between the curves should be assessed in the vertical direction. This shows that the biggest differences between the two groups of genes is treatments 3 and 7, which are cerebellum in respectively chimpanzee and human, where the genes in the node tend have lower expression than those not in the node.