4.6 - Using the Histogram of p-values
We have seen that the histogram of all the p-values of our features plays an important role in estimating FDR. This suggests that we should plot our p-values.
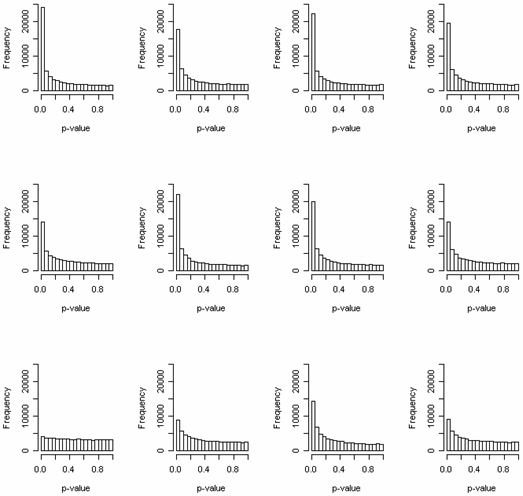
Below is a set of plots from a microarray experiment with multiple treatments. A test was done for each pair of treatments, leading to a large number of pairs, each giving a p-value for each feature. The p-values for each pair of treatments is shown below. Notice that they all have the expected shape, and so the use of q-values is appropriate.
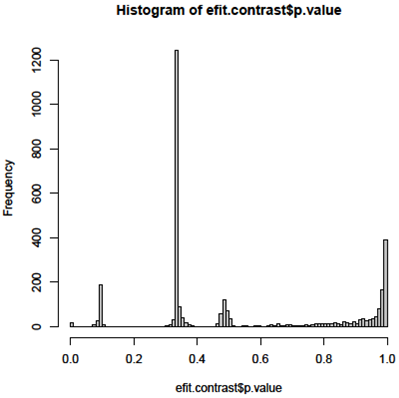
Sometimes our tests do NOT have the expected distribution. Below is the histogram of p-values for a set of p-values from an experiment using an antigene microarray. The histogram is very informative - it tells me that the test statistic does not have the assumed null distribution, and so the computed p-values are not valid. After looking at the data with the microarray provider, we concluded that some of the statistical analysis steps were not appropriate. Another statistical analysis pipeline will need to be developed.
I always look at the histogram of p-values before interpreting the p-values, computing q-values, or estimating \(\pi_0\). There are many reasons that it might not have the ideal shape. If the data are counts (like sequencing data) the histogram has a different characteristic shape, which we will discuss when we discuss sequencing data. If the data are intensities, a hump at low p (rather than the peak near p=0) might indicate correlation among the tests, due to strong association of the features. Another possibility is that the test statistic does not have the assumed null distribution. For example, if a block design was used but the blocks were not accounted for in the statistical analysis, the degrees of freedom of the test statistic will be incorrect. Another possibility is that the data are highly skewed and the sample size is too small for the t-statistic to have a t-distribution.

