13.2 - Differential Binding
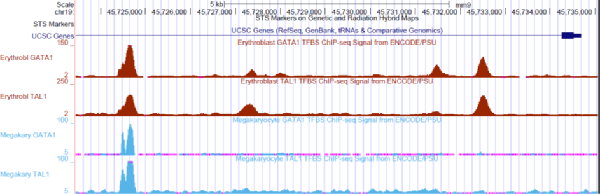
Finally, we take a look at differential bindings. Differential binding analysis should be able to identify not only locations where binding signal is completely lost, but also areas showing significant changes in binding strength. Usually we have several biological replicates and at least two conditions. Typically the peak caller will not give exactly the same peak boundaries in all samples, so it will be necessary to decide peak boundaries that can be used for all the samples. For example, in the 4 samples below, the leftmost peak might be expanded to include all the reads in red (erythroblasts) and the double peak in blue (megakaryocyte).
Next, we count the reads in the binding sites derived from all the samples. This is really the same as defining genes, exons, etc in RNA-seq. We then define the “peak region” and count the number of reads that fall into it. This produces a “reads per feature” table with the same features for every sample.
You can then do differential expression analysis using EdgeR or Voom as we did earlier. The main difference is that there are usually only a few 10s of peaks, rather than 10s of thousands of features.

