13.3 - Example in R
In R several packages are available. DiffBind is recommended because it appears to have all the necessary functionality. Here we show the main output from the analysis of the peaks on chromosome 19. The details are in the ChIP-seq R Lab.
Required inputs:
- bam files of mapped reads from ChIP samples
- bam files of mapped reads from reference samples
- peak locations from a “peak caller”
DiffBind then does the remaining analyses.
Example
Data for Chromosome 19 was prepared from a study of differential binding of GATA1 in 2 cell types.
This not a huge sample. There were 2 erythroblast samples and 3 megakaryocyte samples.
DiffBind reports that you have 5 samples and there were 649 peaks in total that were merged down into 224 consensus peaks that could be used as features in the differential binding analysis.
How many of these peaks were in common in the two cell types? Just 14.
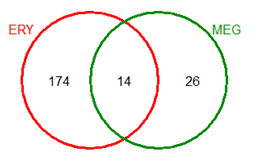
At this point you might ask yourself, should you bother to do a differential binding analysis? The reason for asking this question is that there are only 14 peaks in common. The other 210 sites appear to be "differential" since they are found in only one cell type. However, it is actually not so clear that these sites are unbound in the other cells, since the peak caller must distinguish between the background and real peaks. Both cell types likely have some reads mapped to these regions even though not peaks were called. For this reason, we use all 224 regions as features.
The next step is to count the reads in each of the 224 peaks and do a differential expression analysis using edgeR, voom or DESeq2.
Usually the library size will be the total number of reads in the bam file (not the total in the peaks).
Notice that we found 224 peaks on chromosome 19. Multiply this by the number of chromosomes and you may obtain several thousand peaks, so that the number of features is similar to differential expression analysis. However, unlike differential expression analysis, there is no inexpensive technology that can be used to validate the peak locations and the binding intensity.

