GCD.4 - Applying Tree-Based Methods
Sample R code for
Tree method.
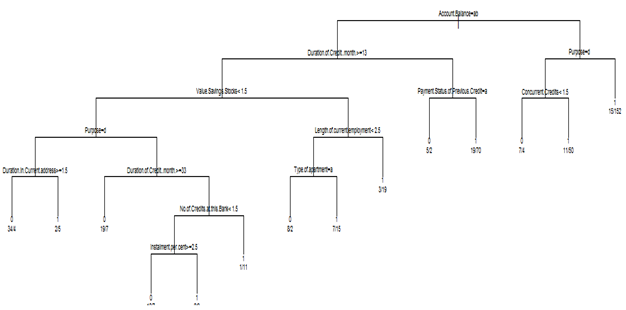
Both categorical and continuous predictors are used for binary classification. Using rpart{library=rpart}, the following tree is obtained without any pruning.
R output:
n= 500
node), split, n, loss, yval, (yprob)
* denotes terminal node
1) root 500 143 1 (0.28600000 0.71400000)
2) Account.Balance=1,2 261 110 1 (0.42145594 0.57854406)
4) Duration.of.Credit..month.>=13 165 79 0 (0.52121212 0.47878788)
8) Value.Savings.Stocks< 1.5 111 43 0 (0.61261261 0.38738739)
16) Purpose=4 45 9 0 (0.80000000 0.20000000)
32) Duration.in.Current.address>=1.5 38 4 0 (0.89473684 0.10526316) *
33) Duration.in.Current.address< 1.5 7 2 1 (0.28571429 0.71428571) *
17) Purpose=1,2,3 66 32 1 (0.48484848 0.51515152)
34) Duration.of.Credit..month.>=33 26 7 0 (0.73076923 0.26923077) *
35) Duration.of.Credit..month.< 33 40 13 1 (0.32500000 0.67500000)
70) No.of.Credits.at.this.Bank< 1.5 28 12 1 (0.42857143 0.57142857)
140) Instalment.per.cent>=2.5 17 7 0 (0.58823529 0.41176471) *
141) Instalment.per.cent< 2.5 11 2 1 (0.18181818 0.81818182) *
71) No.of.Credits.at.this.Bank>=1.5 12 1 1 (0.08333333 0.91666667) *
9) Value.Savings.Stocks>=1.5 54 18 1 (0.33333333 0.66666667)
18) Length.of.current.employment< 2.5 32 15 1 (0.46875000 0.53125000)
36) Type.of.apartment=1 10 2 0 (0.80000000 0.20000000) *
37) Type.of.apartment=2,3 22 7 1 (0.31818182 0.68181818) *
19) Length.of.current.employment>=2.5 22 3 1 (0.13636364 0.86363636) *
5) Duration.of.Credit..month.< 13 96 24 1 (0.25000000 0.75000000)
10) Payment.Status.of.Previous.Credit=1 7 2 0 (0.71428571 0.28571429) *
11) Payment.Status.of.Previous.Credit=2,3 89 19 1 (0.21348315 0.78651685) *
3) Account.Balance=3 239 33 1 (0.13807531 0.86192469)
6) Purpose=4 72 18 1 (0.25000000 0.75000000)
12) Concurrent.Credits< 1.5 11 4 0 (0.63636364 0.36363636) *
13) Concurrent.Credits>=1.5 61 11 1 (0.18032787 0.81967213) *
7) Purpose=1,2,3 167 15 1 (0.08982036 0.91017964) *
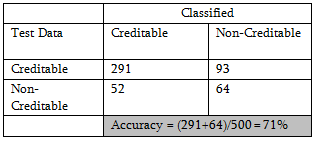
Applying the procedure on Test data, classification probability shows improvement.
The CP table is as follows:
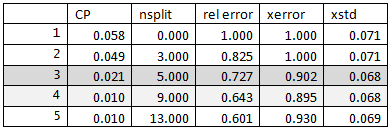
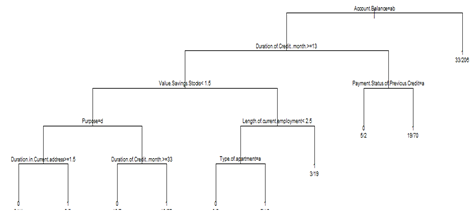
Following is the result for pruning the above tree for cross-validated classification error rate 90%.
n= 500
node), split, n, loss, yval, (yprob)
* denotes terminal node
1) root 500 143 1 (0.2860000 0.7140000)
2) Account.Balance=1,2 261 110 1 (0.4214559 0.5785441)
4) Duration.of.Credit..month.>=13 165 79 0 (0.5212121 0.4787879)
8) Value.Savings.Stocks< 1.5 111 43 0 (0.6126126 0.3873874)
16) Purpose=4 45 9 0 (0.8000000 0.2000000)
32) Duration.in.Current.address>=1.5 38 4 0 (0.8947368 0.1052632) *
33) Duration.in.Current.address< 1.5 7 2 1 (0.2857143 0.7142857) *
17) Purpose=1,2,3 66 32 1 (0.4848485 0.5151515)
34) Duration.of.Credit..month.>=33 26 7 0 (0.7307692 0.2692308) *
35) Duration.of.Credit..month.< 33 40 13 1 (0.3250000 0.6750000) *
9) Value.Savings.Stocks>=1.5 54 18 1 (0.3333333 0.6666667)
18) Length.of.current.employment< 2.5 32 15 1 (0.4687500 0.5312500)
36) Type.of.apartment=1 10 2 0 (0.8000000 0.2000000) *
37) Type.of.apartment=2,3 22 7 1 (0.3181818 0.6818182) *
19) Length.of.current.employment>=2.5 22 3 1 (0.1363636 0.8636364) *
5) Duration.of.Credit..month.< 13 96 24 1 (0.2500000 0.7500000)
10) Payment.Status.of.Previous.Credit=1 7 2 0 (0.7142857 0.2857143) *
11) Payment.Status.of.Previous.Credit=2,3 89 19 1 (0.2134831 0.7865169) *
3) Account.Balance=3 239 33 1 (0.1380753 0.8619247) *
There is minor improvement in accuracy % also
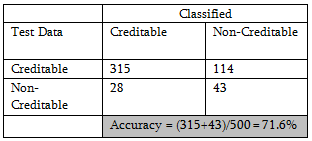
Conclusion: For this data set tree-based method seems to be working better than logistic regression or discriminant analysis.

