WQD.3 - Application of Polynomial Regression
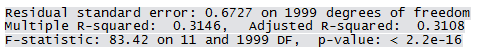
In order to investigate whether a polynomial relationship fits the model better, an alternative model with squared terms of the significant variables is tried, which improves R2 value to 31%.
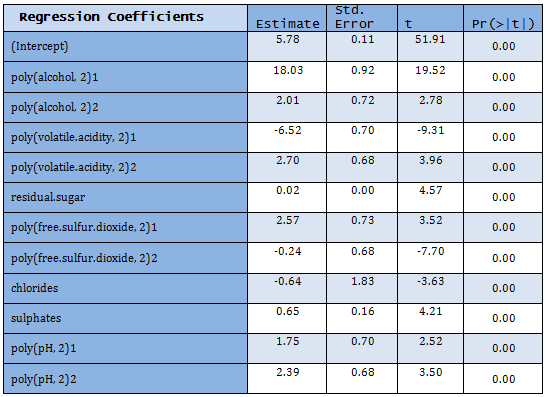
Sample R output:
Application of this model on test data gives sum of square of differences between the actual response and predicted response to be 1139.41 whereas sum of square of deviations of actual response is 1554.754. Ratio of these two may be taken as the ratio of Error sum of squares and total sum of squares. Hence a measure similar to that of R2 may be computed as 1 – 1139.41/1554.754 = 0.2671.

