Sample R code for Tree-based Models and Random Forest
FactQ <- as.factor(quality)
WhiteWineLib <- cbind(WhiteWineLib, FactQ)
temp <- recode(WhiteWineLib$FactQ, "c('3','4','5')='10'; c('6')='20'; else='40'")Ptemp <- recode(temp, "c('10')='5'; ('20')='6'; else='7'")WhiteWineLib$FactQ <- Ptemp
prop.table(table(WhiteWineLib$FactQ))
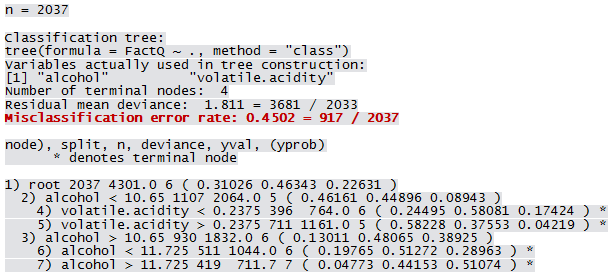
WhiteWineTree <- tree(FactQ ~ fixed.acidity+volatile.acidity+citric.acid+residual.sugar+chlorides+free.sulfur.dioxide+total.sulfur.dioxide+pH+sulphates+alcohol+density, data=WhiteWineLib, method="class")
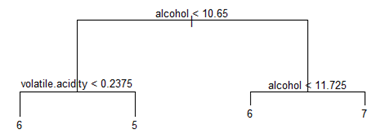
plot(WhiteWineTree)
text(WhiteWineTree, pretty=0, cex=0.6)
misclass.tree(WhiteWineTree, detail=T)
Treefit1 <- predict(WhiteWineTree, WhiteWineLib, type="class")
table(Treefit1, WhiteWineLib$FactQ)
WWrf50_super <- randomForest(FactQ ~ . , data=WWTrain50T[,-12], ntree=150, importance=T, proximity=T)
WWTest50_rf_pred_super <- predict(WWrf50_super, WWTest50, type="class")
table(WWTest50_rf_pred_super, WWTest50$FactQ1)
plot(WWrf50_super, main="")
varImpPlot(WWrf50_super, main="", cex=0.8)
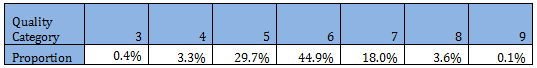
The response variable quality is assumed to be an ordinal variable, not a continuous variable. It has been noted before that proportions in too low (4 or less) or too high (8 or above) categories are small.
Hence wines are classified into three categories by combining 3, 4, and 5 into one category (Low), 6 (Medium) and 7, 8 and 9 into another (High).
Applying the procedure on Test data, the following mis-classification table is obtained: